
Hello world#
The repository examples folder contains low-resolution configurations for
quick testing. Generate and run SPE11B, then write all benchmark data and
figures:
pyopmspe11 -i spe11b.toml -o spe11b -m all -g all -t 5 -r 50,1,15 -w 1

CO2 mass mapped from the corner-point simulation grid to a 50 by 15 reporting grid.#
This deliberately coarse grid runs quickly. See Benchmark for finer benchmark configurations.
Generate only the OPM input files without running Flow:
pyopmspe11 -i spe11b.toml -o spe11b -m deck
Change the model value in the TOML file to create immiscible, isothermal,
and convective cases, then run:
pyopmspe11 -i immiscible.toml -o immiscible -m deck_flow_data -w 1
pyopmspe11 -i isothermal.toml -o isothermal -m deck_flow_data -w 1
pyopmspe11 -i convective.toml -o convective -m deck_flow_data -w 1
Compare the current result folders:
pyopmspe11 -c spe11b
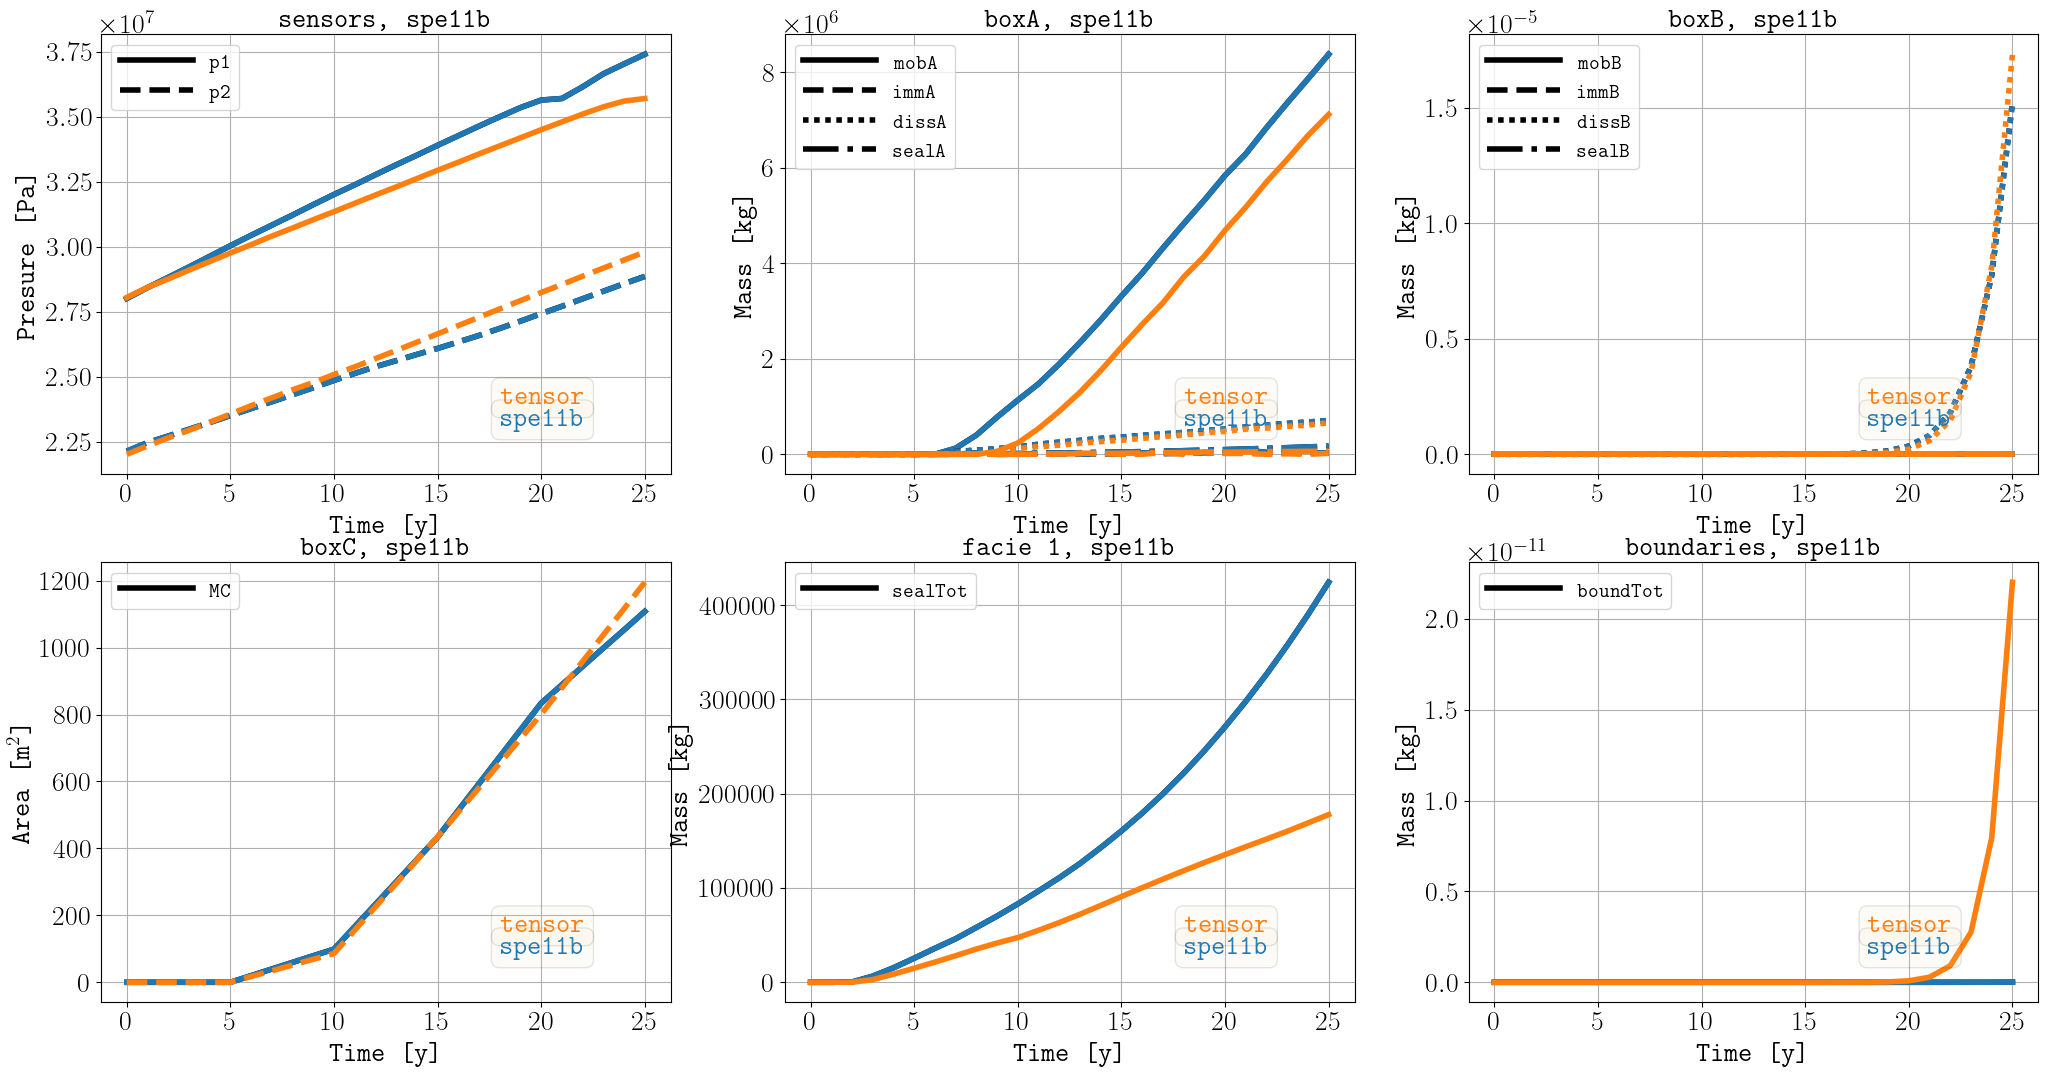
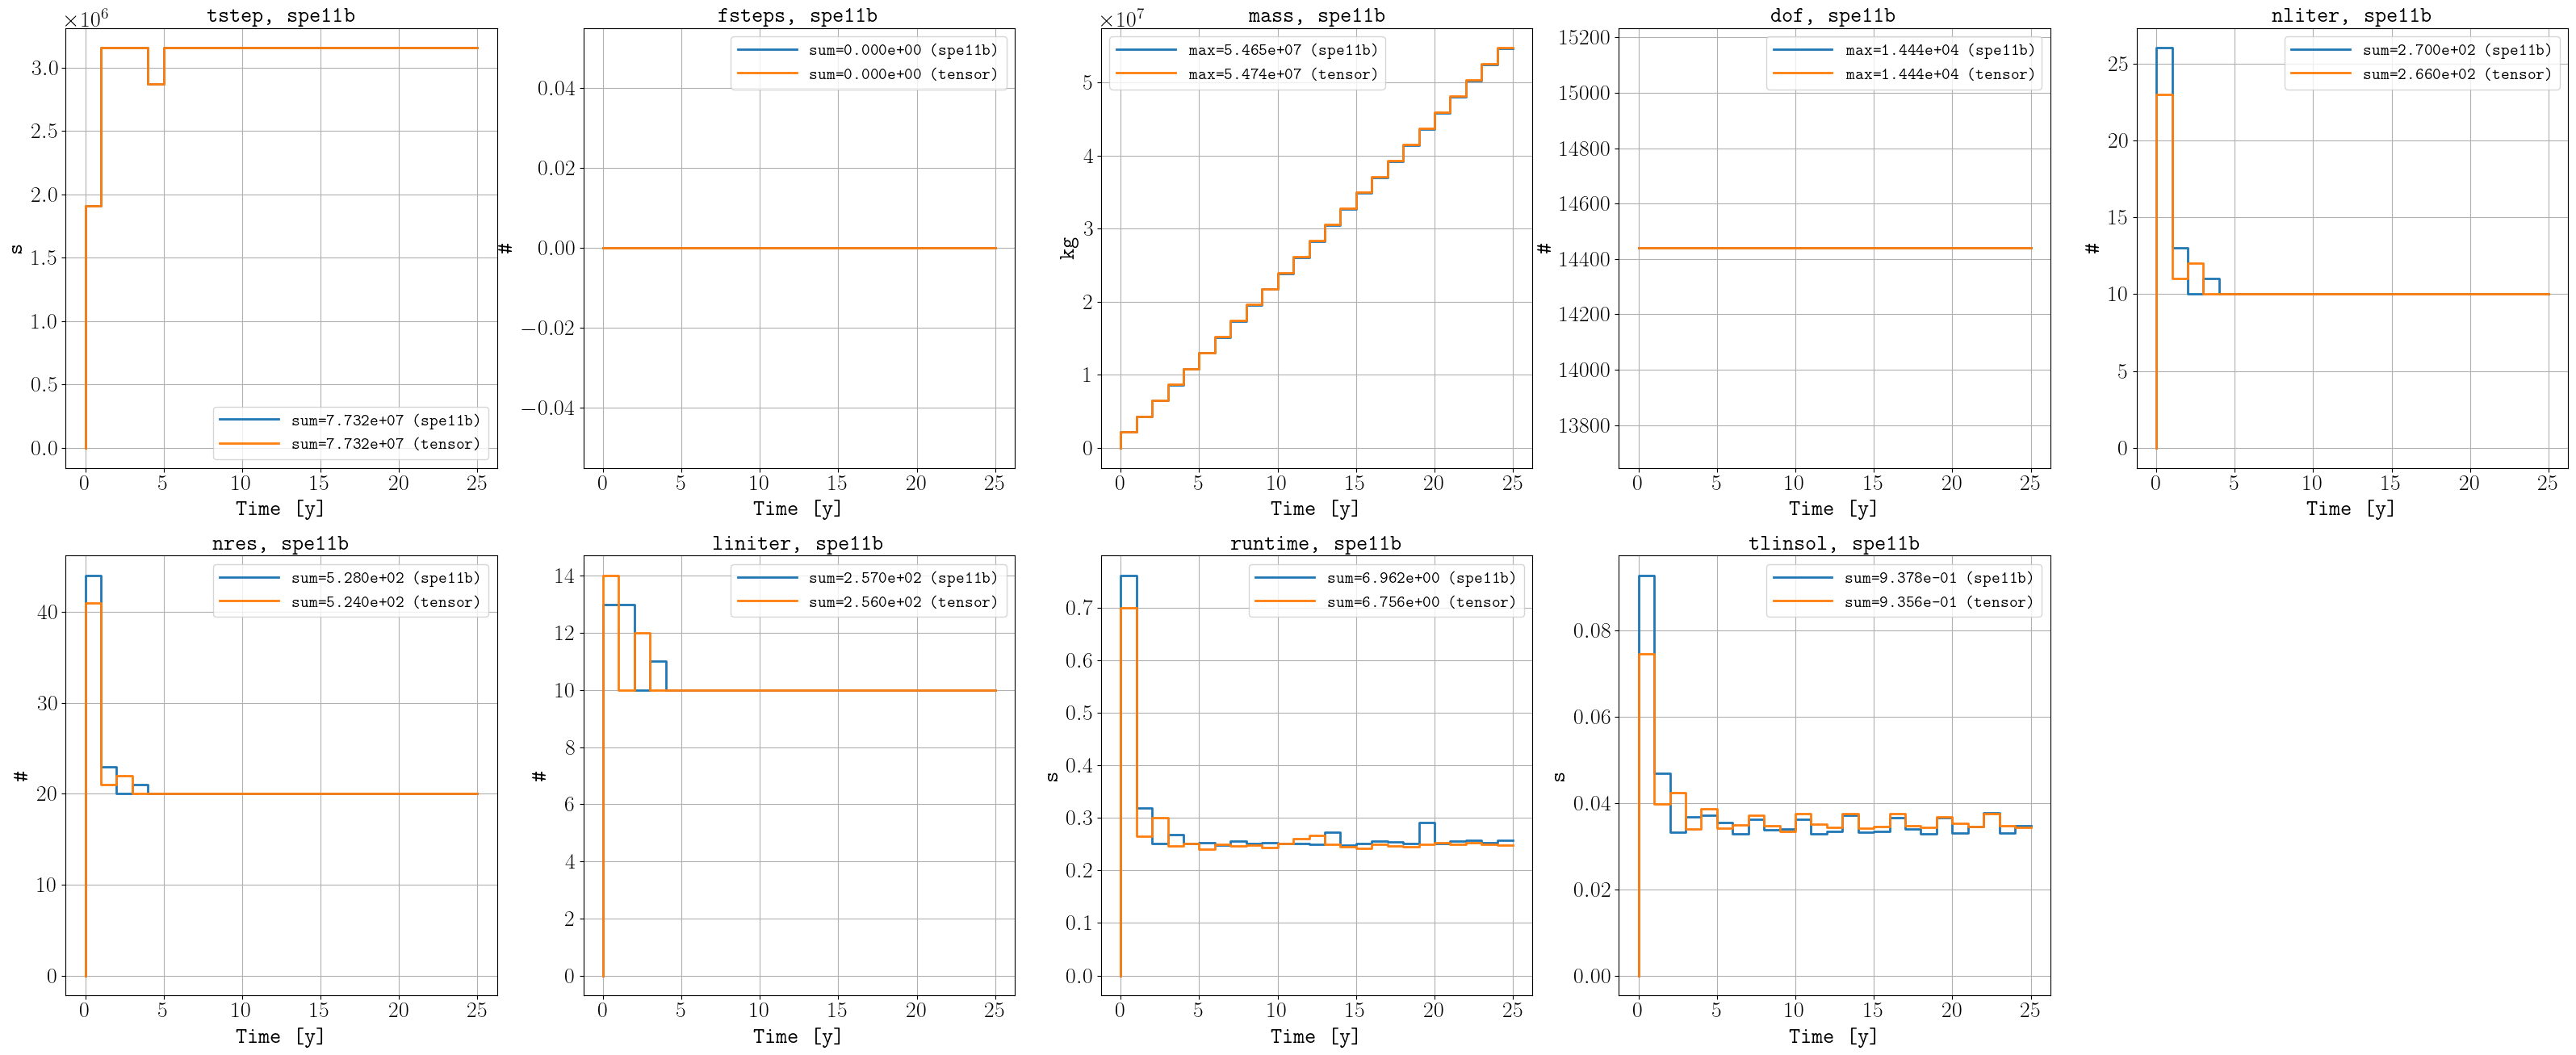
Immiscible and isothermal simulations run faster because they have fewer degrees of freedom.#
Use plopm for additional result visualization:
pip install git+https://github.com/cssr-tools/plopm.git
plopm -i isothermal/flow/ISOTHERMAL -v sgas -t 'Isothermal simulation (end of simulation)'
plopm -i "immiscible/data/spe11b_time_series convective/data/spe11b_time_series" -csv 1,4 -labels "Immiscible  Convective" -tunits y -ylabel 'mobA [kg]' -xformat .0f -x '[0,25]' -xlnum 6 -f 20 -d 10,5 -yformat .1e -e 'solid,solid' -lw 4 -step 1

Reproduce this example#
. ./tests/scripts/docs_hello_world.sh