Introduction

This documentation describes the pyopmspe11 package hosted in https://github.com/OPM/pyopmspe11.
Concept
Simplified and flexible framework for the three cases in the SPE Comparative Solution Project via a configuration file using the OPM Flow simulator:
Set the path to the OPM Flow simulator and simulator flags.
Set the grid type (Cartesian, tensor, or corner-point grid) and the number of cells.
Set the rock and fluid properties.
Set the wells or sources locations and define the injection schedule.
Select the functionality (e.g., generate only the input decks, run the whole framework).
The framework generates the data in the same format as requested in the benchmark.
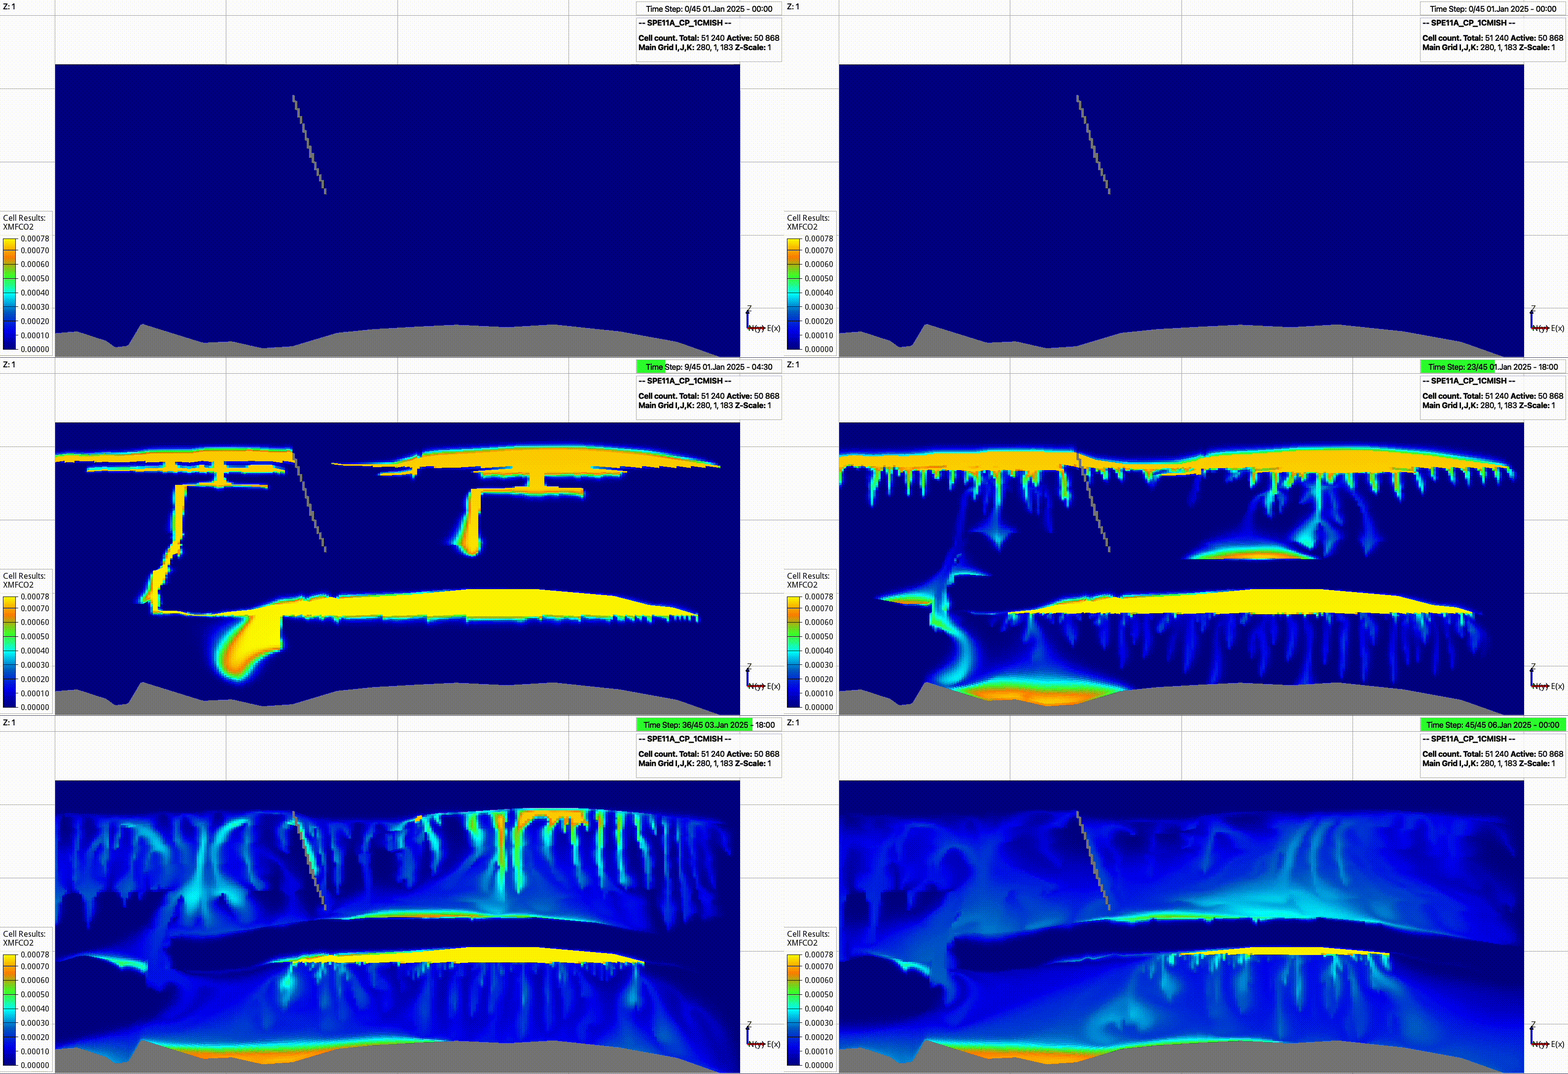
In addition, it generates .png figures for quick inspection of the results.
Also, it generates figures for comparison between runs (i.e., to assess sensitivities).
Overview
The current implementation supports the following executable with the argument options:
pyopmspe11 -i configuration_file
where
- -i
The base name of the configuration file (‘input.toml’ by default).
- -o
The base name of the output folder (‘output’ by default).
- -m
Run the whole framework (‘all’), only create decks (‘deck’), only run flow (‘flow’), only write benchmark data (‘data’), only create plots (‘plot’), deck and run (‘deck_flow’), data and plot (‘data_plot’), run and data (‘flow_data’), deck, run, and data (‘deck_flow_data’), or flow, data, and plot (‘flow_data_plot’) (‘deck_flow’ by default).
- -g
Write only the ‘dense’, ‘sparse’, ‘performance’, ‘performance-spatial’, ‘dense_performance’, ‘dense_sparse’, ‘performance_sparse’, ‘dense_performance-spatial’, ‘dense_performance_sparse’, or ‘all’ (‘performance_sparse’) by default.
- -r
Number of x, y, and z elements to map the simulation results to the dense report data (‘8,1,5’ by default).
- -t
If one number, time step for the spatial maps (spe11a [h]; spe11b/c [y]) (‘5’ by default); otherwise, times separated by commas.
- -w
Time interval for the sparse and performance data (spe11a [h]; spe11b/c [y]) (‘0.1’ by default).
- -c
Generate a common plot for the current folders for ‘spe11a’, ‘spe11b’, or ‘spe11c’ (’’ by default).
- -s
Set to 1 to show Python warnings (‘0’ by default).
- -f
Set to 0 to not create the subfolders deck, flow, data, and figures, i.e., to write all generated files in the output directory (‘1’ by default).
- -n
Region to model; valid options are ‘lower’ or ‘’ (all reservoir) (’’ by default).