
Full domain#
The full-domain study uses nominal grid sizes of 40, 20, 10, and 5 m. Edit the
sizes variable in convergence.py
to add or remove refinements.
Main results#
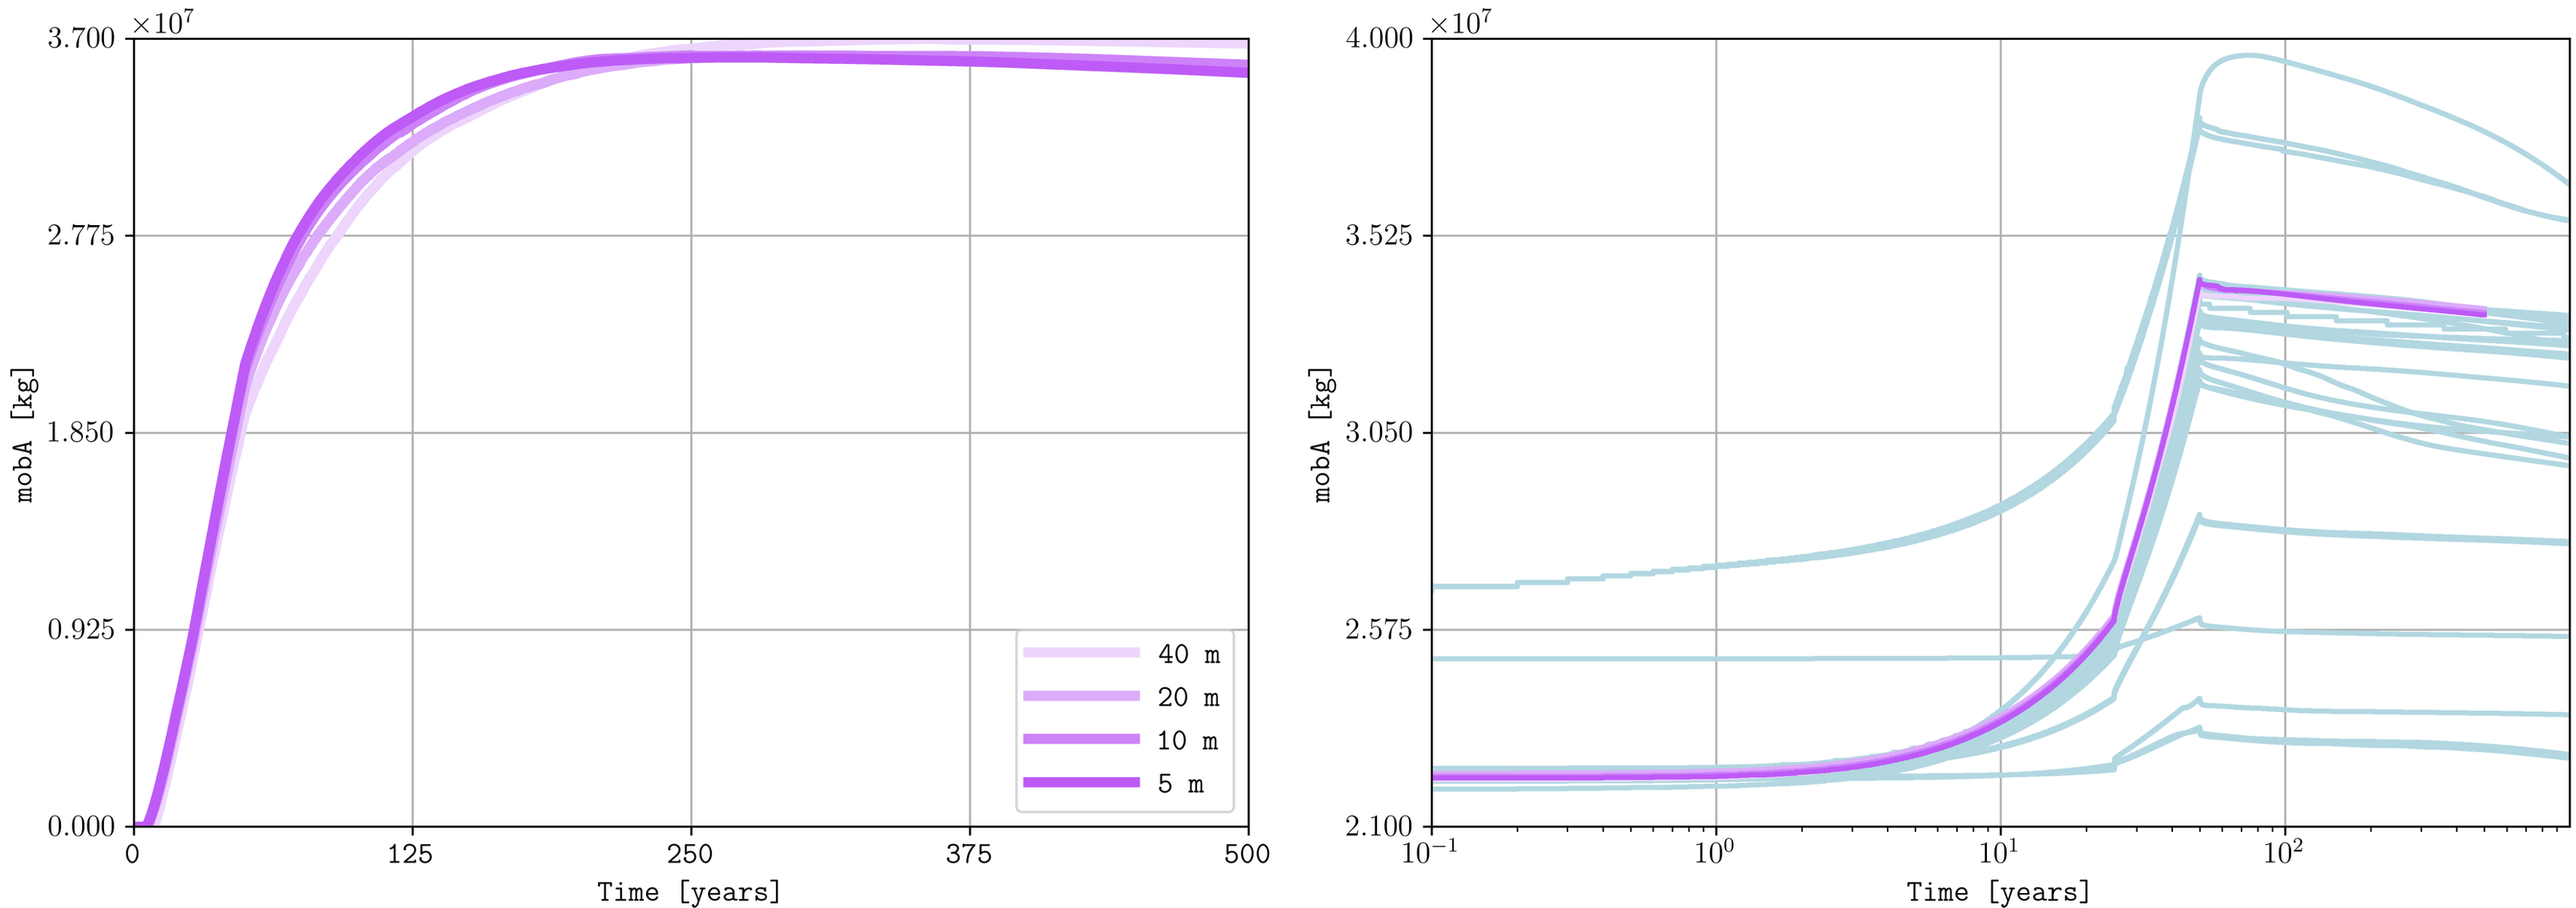
Mobile CO2 in box A for the four grid refinements, shown alone and with the selected benchmark participants. The participant comparison uses a logarithmic time axis.#

Full-domain spatial results for the grid-refinement study and selected SPE11 benchmark participants.#
The convergence script downloads SPE11 participant data and compares it with the pyopmspe11 simulations. It uses plopm CSV support to combine participant data, simulation results, spatial maps, and time series in consistent figures.
The plotting commands can be modified to change the selected participants, colors, line widths, line styles, labels, and figure dimensions.
Spatial-map comparison#
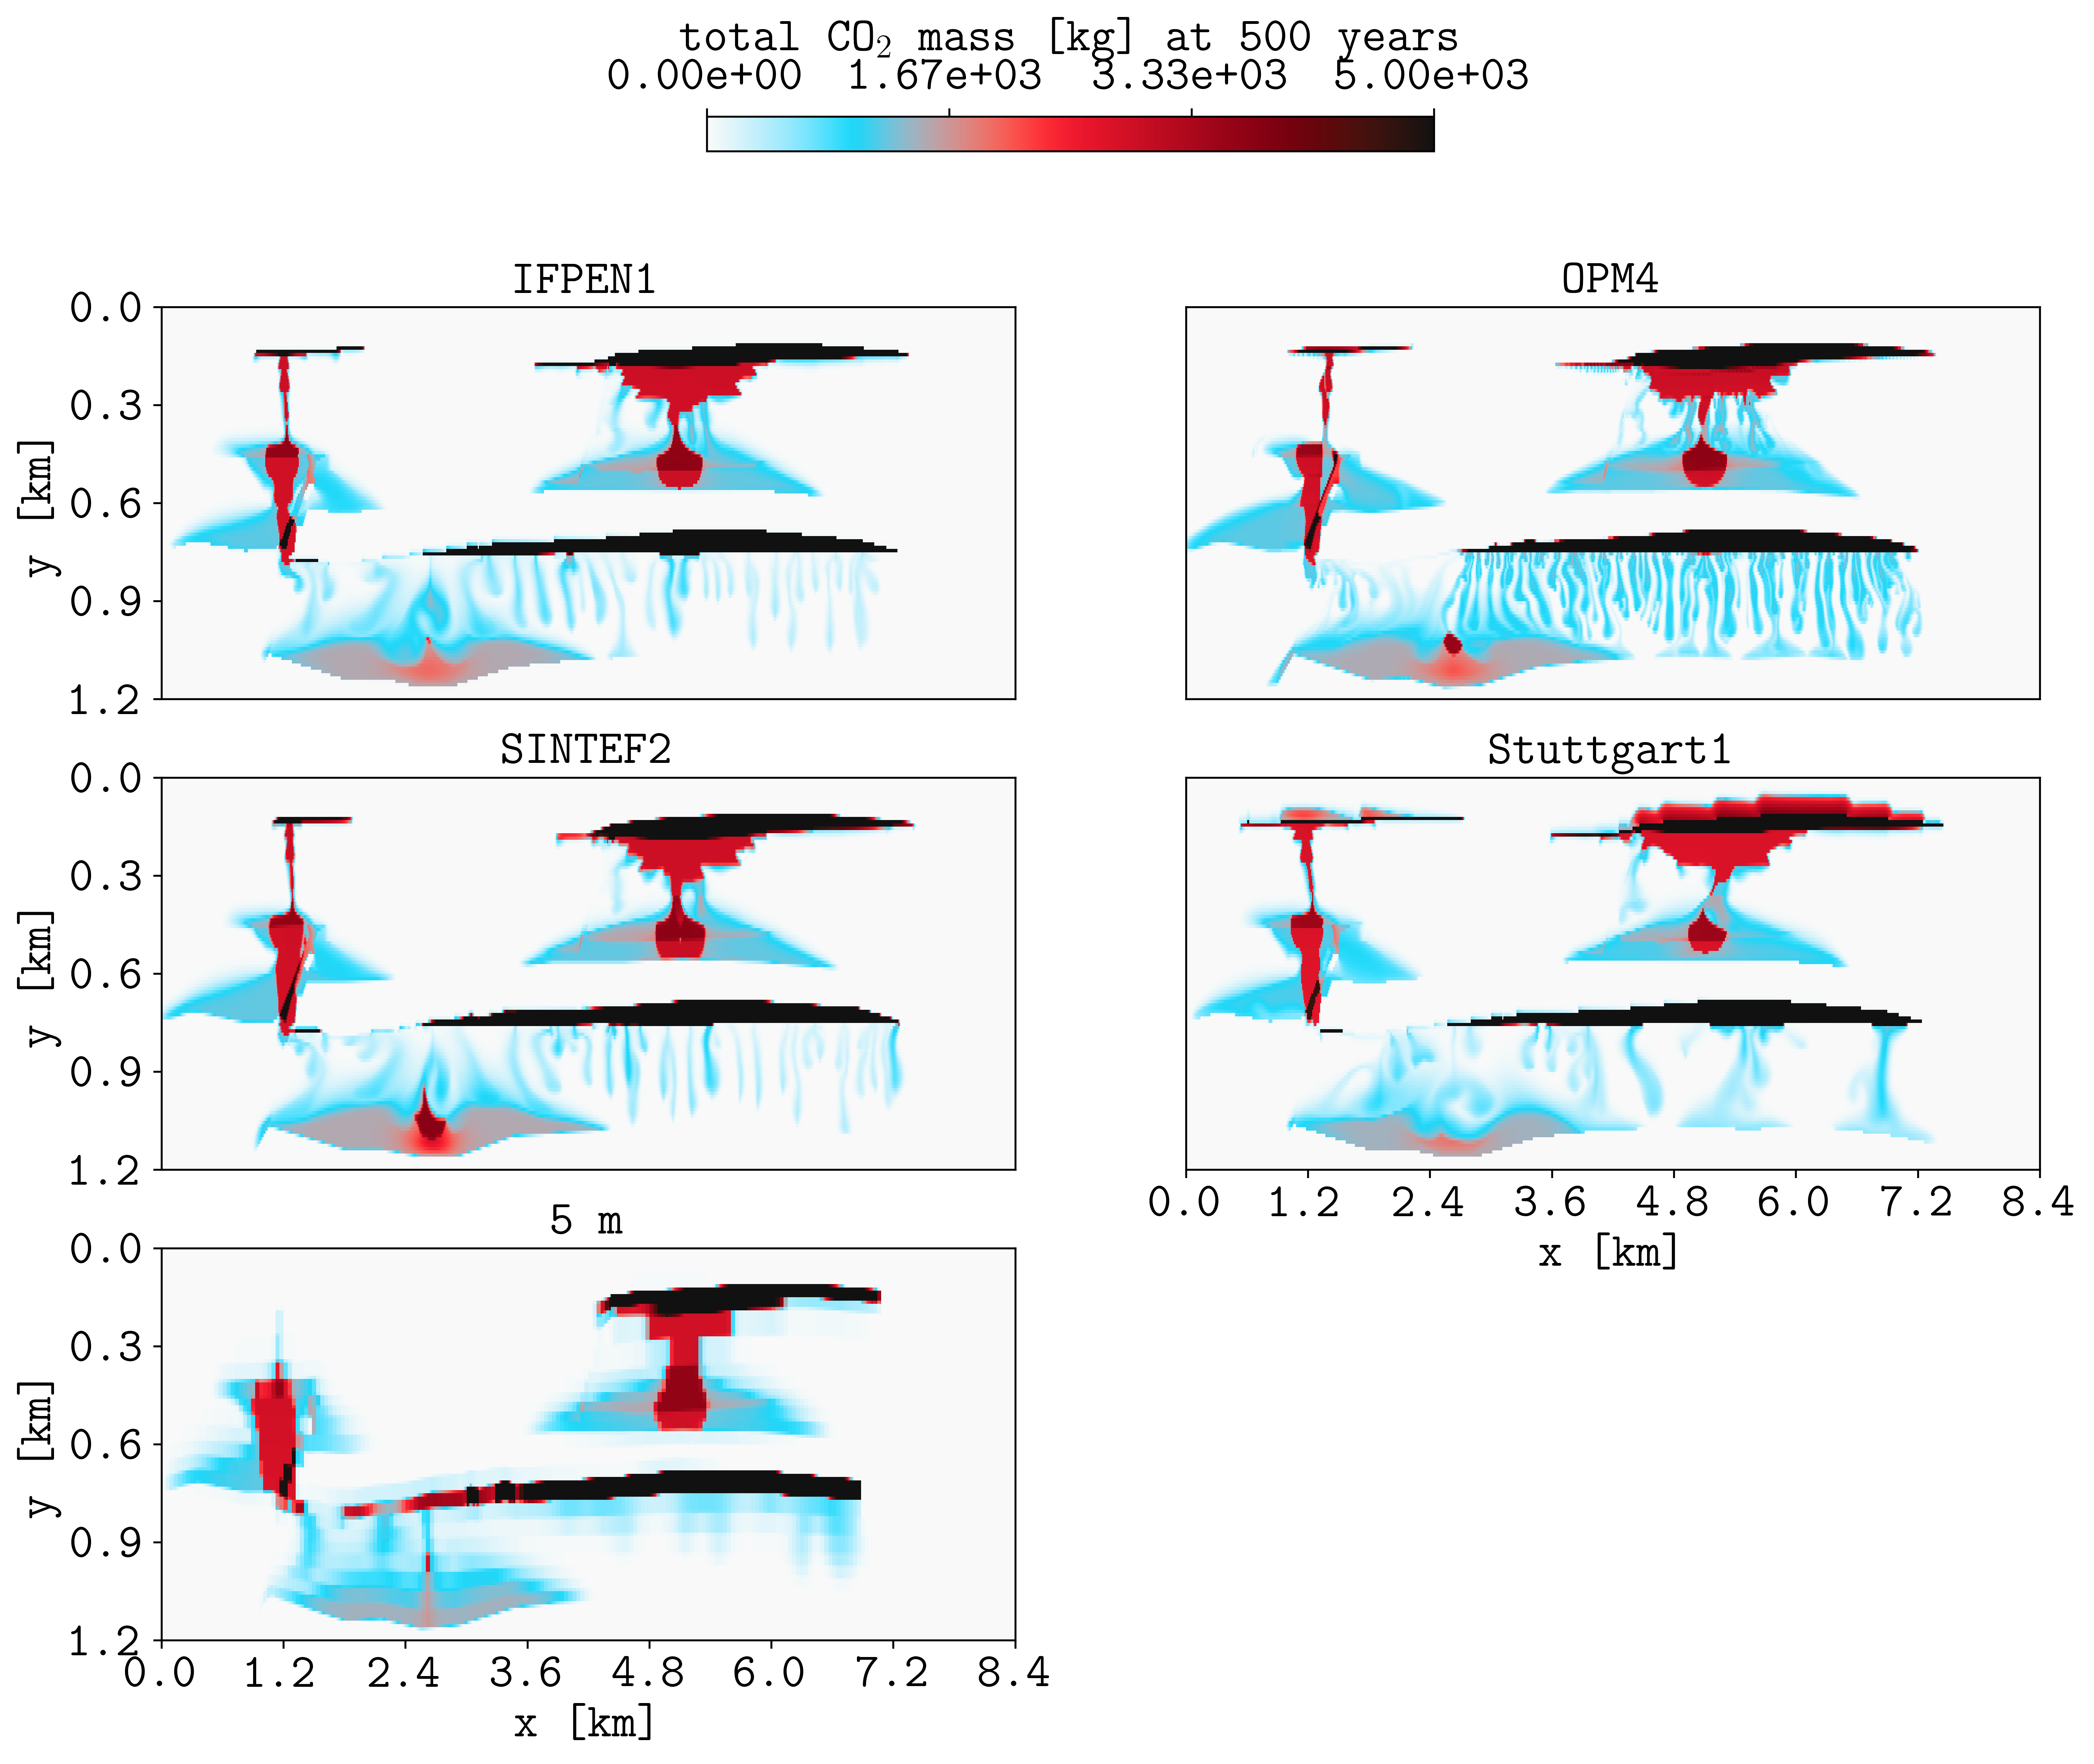
Compare the 5 m simulation with selected participants from Figure 7 of the SPE11 benchmark paper:
plopm -i "spe11b/ifpen1/spe11b_spatial_map_500y spe11b/opm4/spe11b_spatial_map_500y spe11b/sintef2/spe11b_spatial_map_500y spe11b/stuttgart1/spe11b_spatial_map_500y full_cp0-z40mish-x40m/spe11b_spatial_map_500y" -cc "1,2,9" -sg 3,2 -rdl 1 -st 0 -asp 0 -cbp 0.35,0.97,0.3,0.02 -yu km -xu km -yf .1f -fz 20 -xf .1f -cbn 4 -xnt 8 -cbf .2e -fs 14,10 -t "IFPEN1 OPM4 SINTEF2 Stuttgart1 5 m" -cbl 'Total CO$_2$ mass [kg] at 500 years' -c cet_CET_CBTL1_r -cl '[0,5e3]'
Time-series comparison#
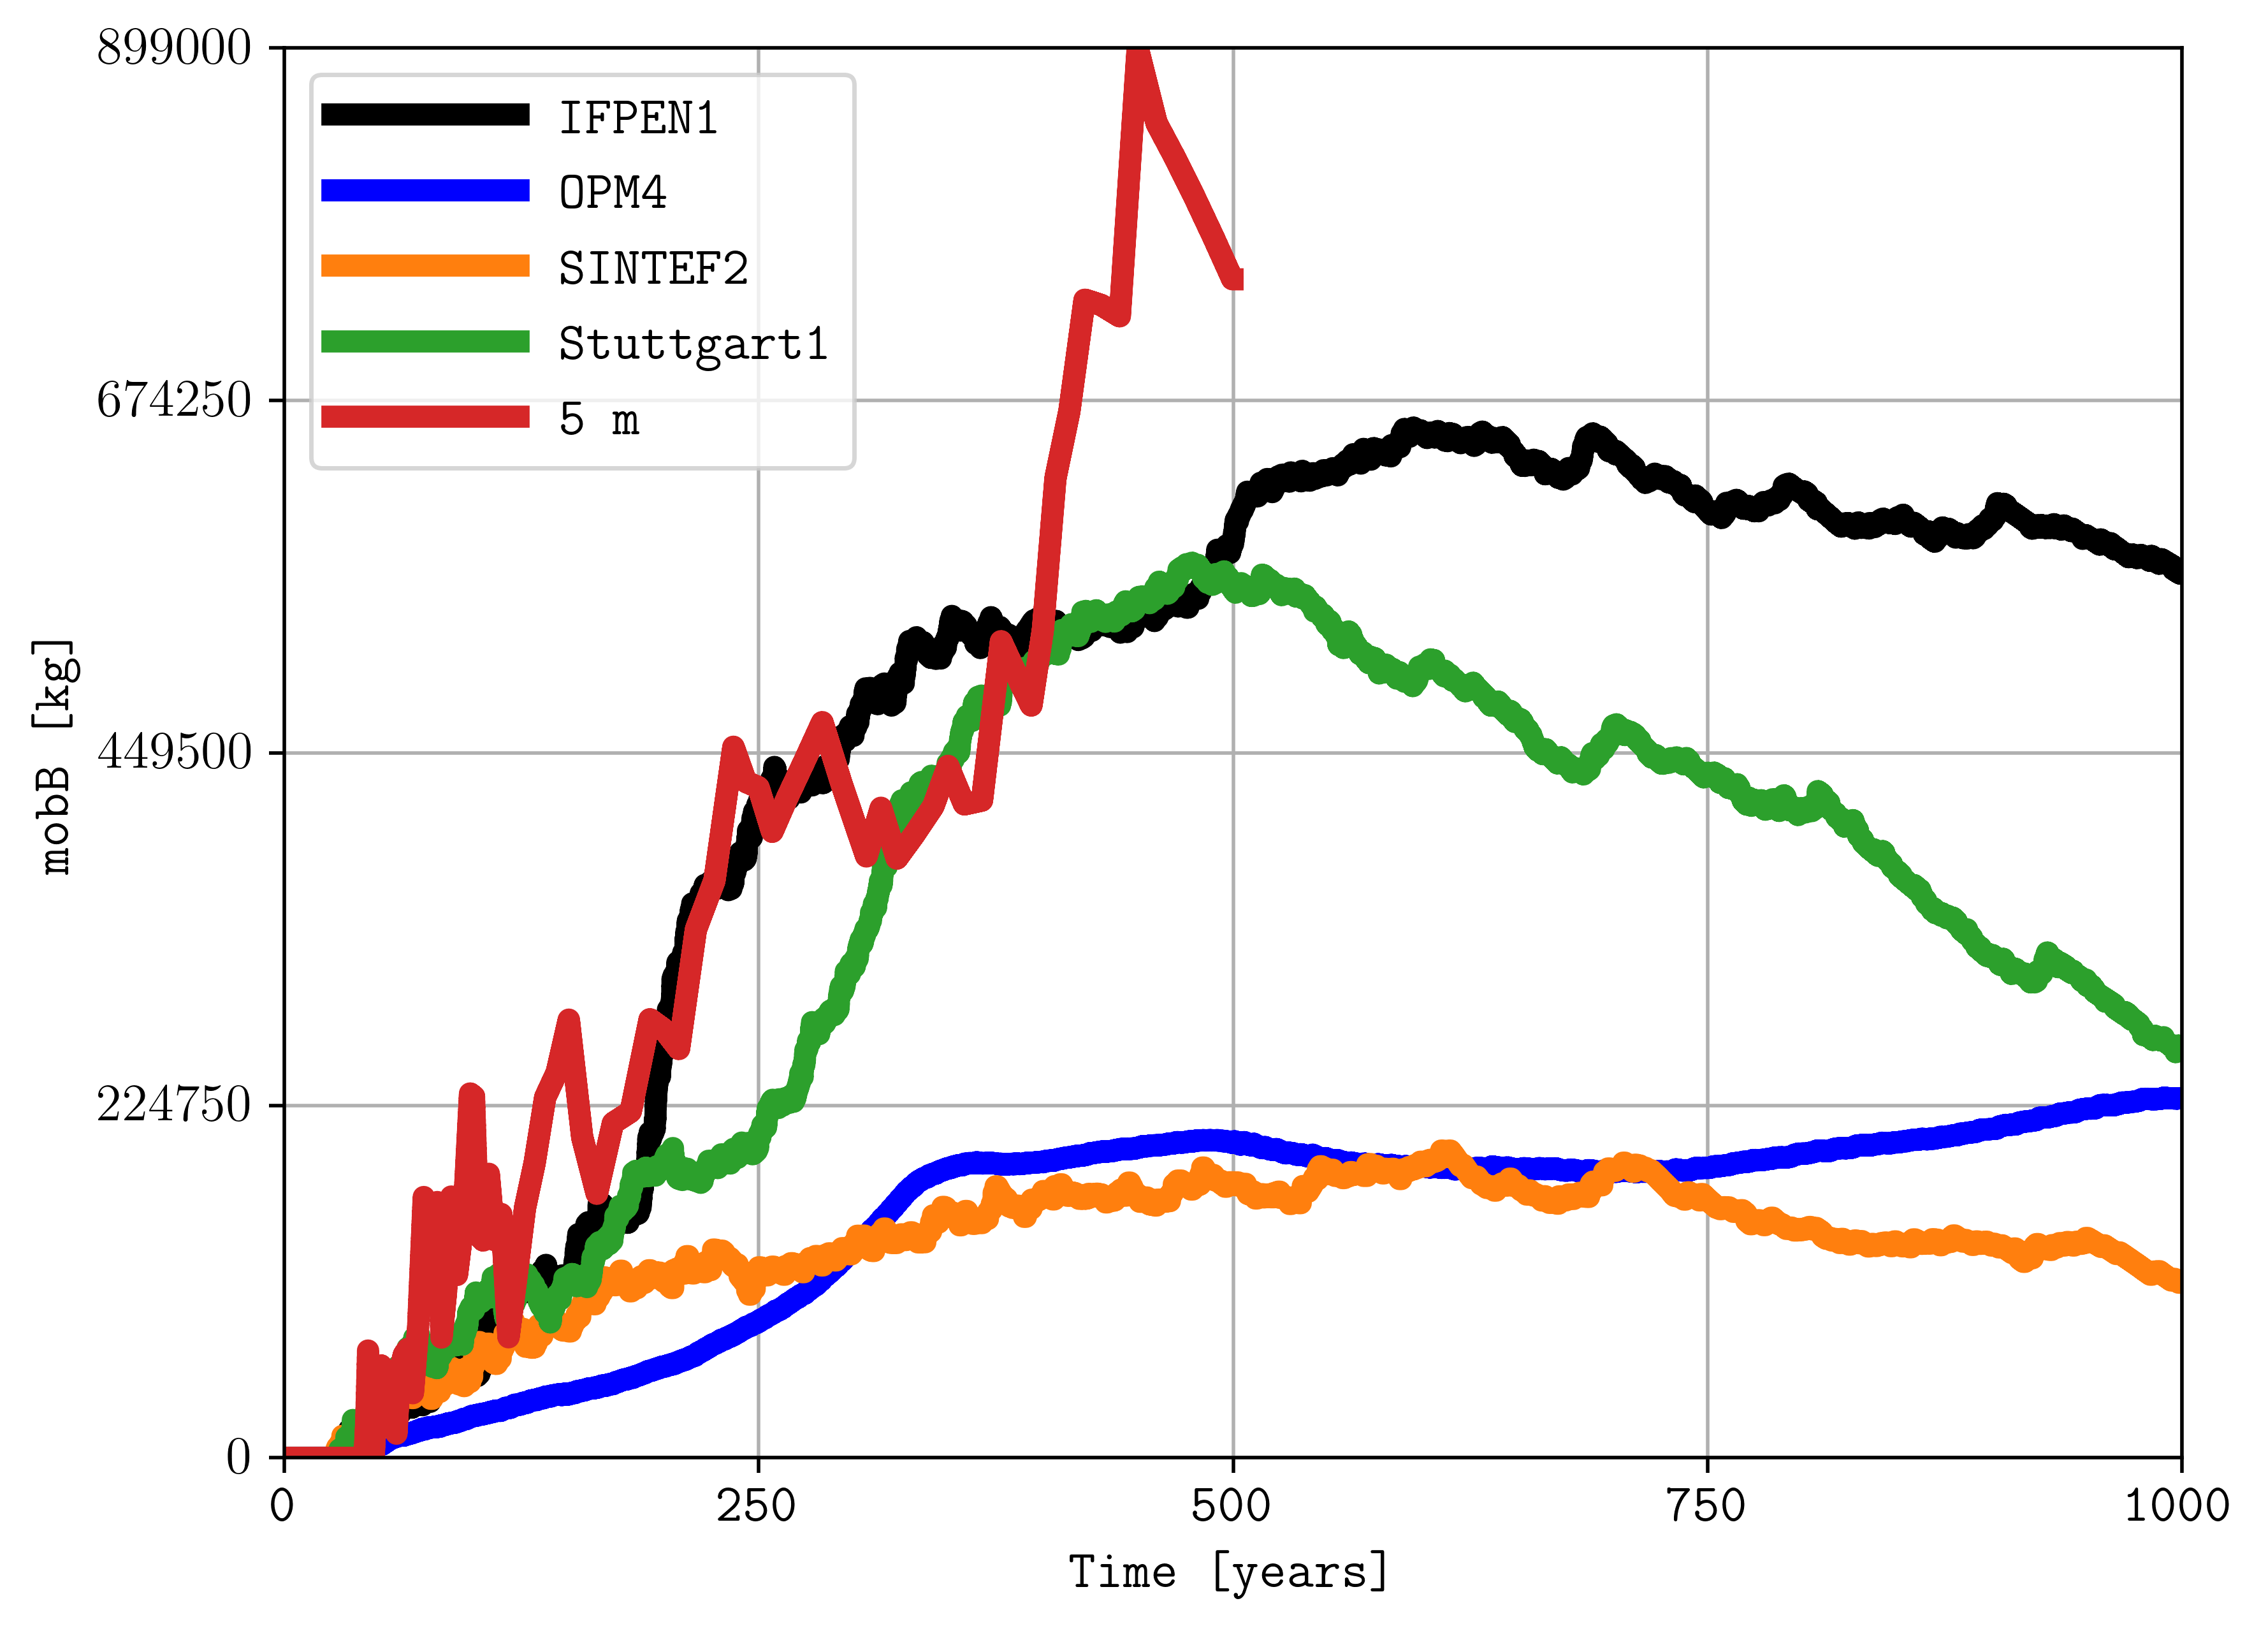
Compare mobB for the same participants and the 5 m simulation:
plopm -i "spe11b/ifpen1/spe11b_time_series spe11b/opm4/spe11b_time_series spe11b/sintef2/spe11b_time_series spe11b/stuttgart1/spe11b_time_series full_cp0-z40mish-x40m/spe11b_time_series" -cc "1,9" -llb "IFPEN1 OPM4 SINTEF2 Stuttgart1 5 m" -yl "mobB [kg]" -tu y -xf .0f -x '[0,1000]' -lw 5 -ls solid
Animated comparison#
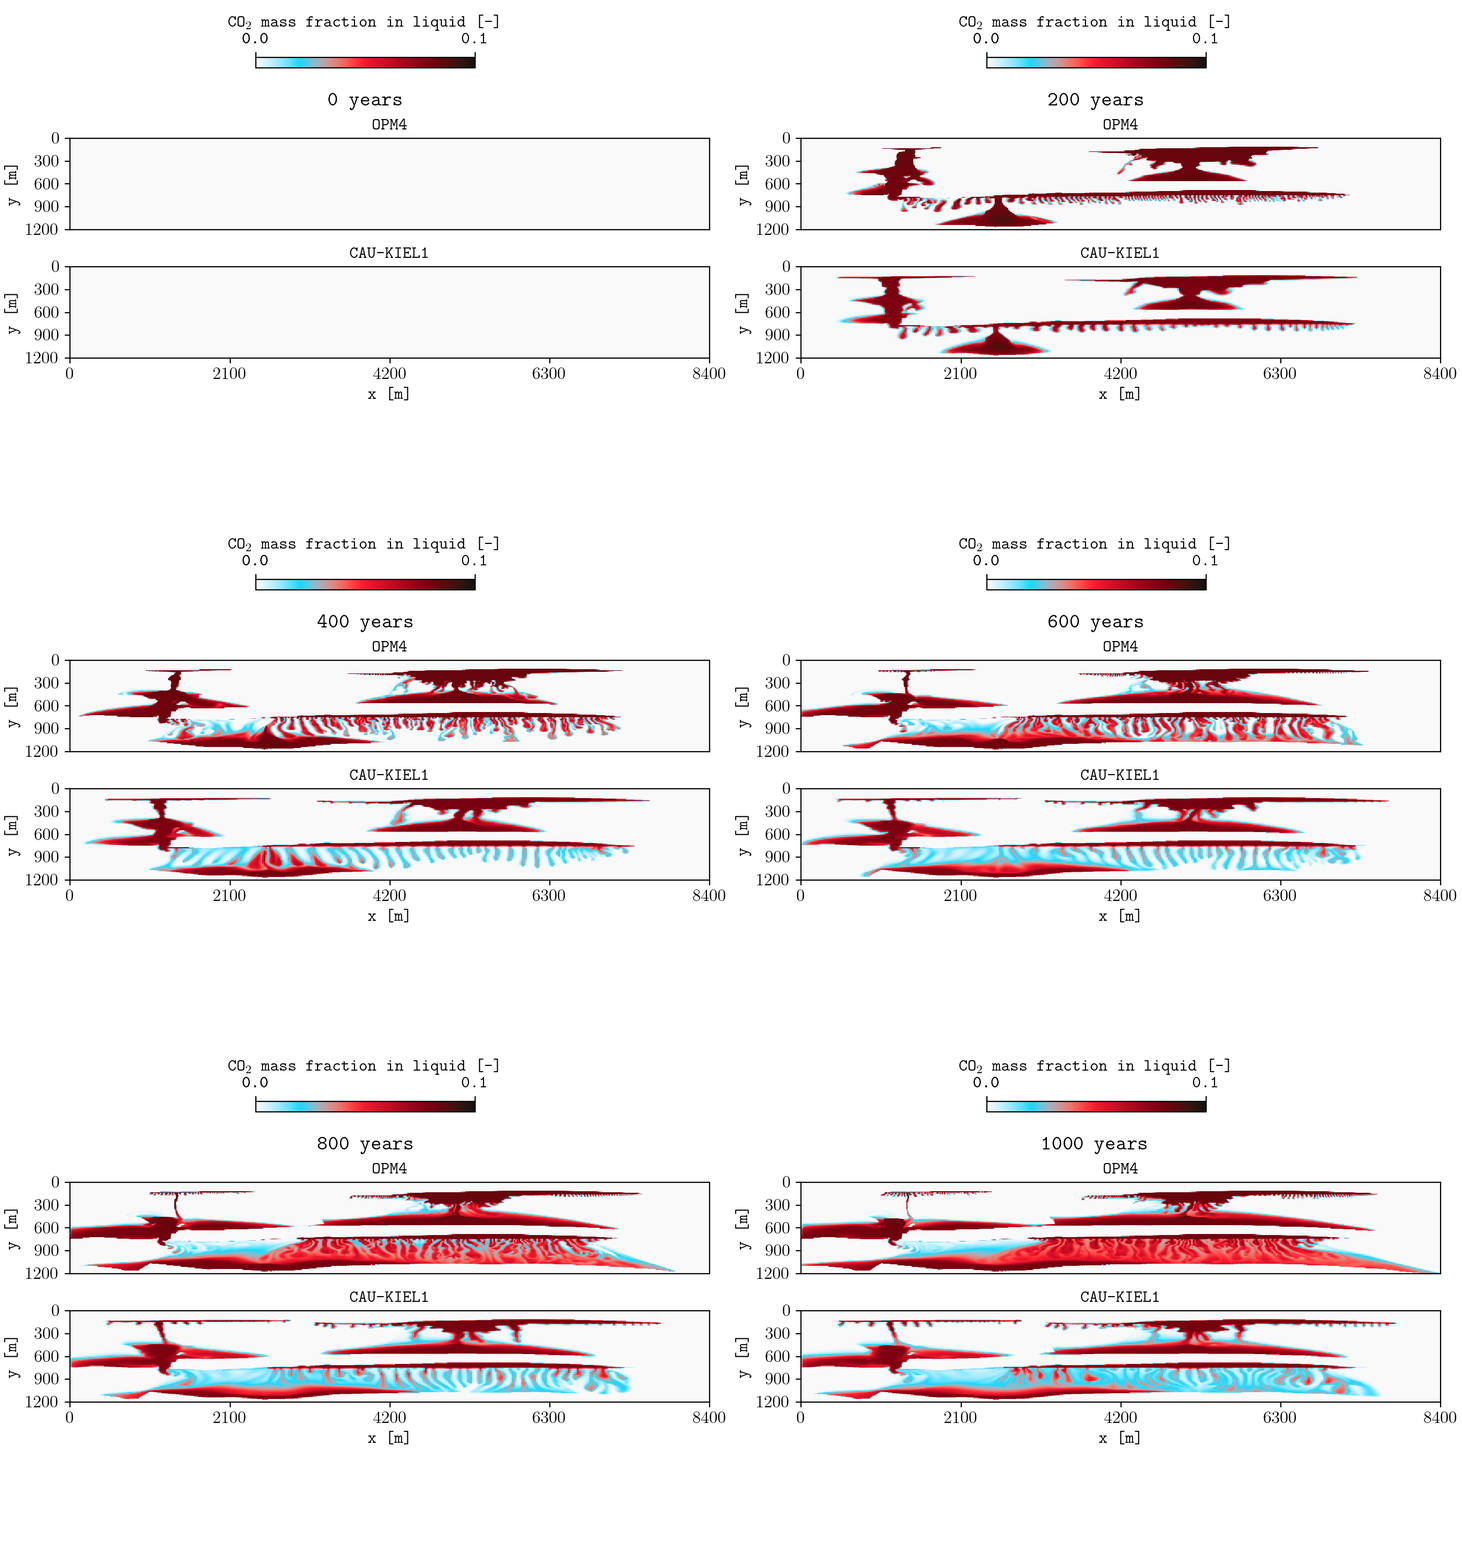
Compare OPM4 and CAU-KIEL1 every 25 years. PLOPM in the input filename is
replaced by the time selected with -r:
plopm -i 'spe11b/opm4/spe11b_spatial_map_PLOPMy spe11b/cau-kiel1/spe11b_spatial_map_PLOPMy' -r 0:1000:25 -cc '1,2,5' -m gif -gi 1000 -gl 1 -sg 2,1 -tu y -t 'OPM4 CAU-KIEL1' -c cet_CET_CBTL1_r -cbl 'CO$_2$ mass fraction in liquid [-]' -cbp 0.35,0.87,0.3,0.02 -rdl 1
See the plopm documentation for the complete option reference and additional PNG, GIF, and CSV examples.
Continue#
See Lower domain for the localized convergence study.
Use SPE11B for the SPE11B benchmark configurations.
See Configuration reference for configuration-variable definitions.