Ensemble Contour Maps
ResInsight can create contour maps from an ensemble of grid models based on different forms of aggregation of 3D reservoir simulation data onto a 2D plane.
Video Tutorial: Ensemble Contour Map
Creating Contour Maps
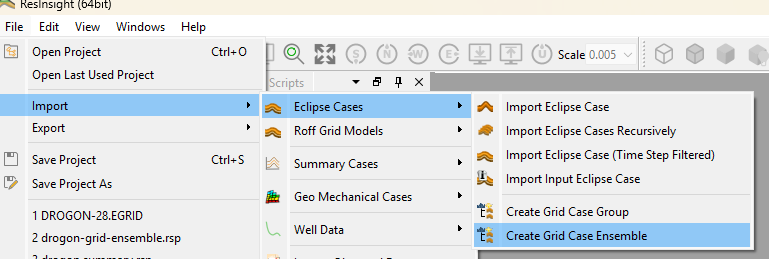
Import grid models using the Import->Eclipse Cases->Create Grid Case Ensemble. The grid models can have individually specified geometry. For grids with equal geometry, consider using Grid Case Group. The formation information is imported for each grid.
Select “New Ensemble Contour Map” from the right-click menu on the grid ensemble.
Properties of the Contour Maps

The General group is used to define how to compute the contour map. See Contour Map for details.
The grid case model defined by “Primary Case” is used for fault and simulation well visualization. The 2D area used to evaluate the contour map values is based on the bounding box of the Primary Case. Use Bounding Box Expansion to ensure that the area covers the geometry variation within the ensemble.
Time Step Selection
Select the time steps to compute the contour map for.
Formation Selection
Select the formations to compute the contour map for.
Result Definition
Select the property to compute the contour map for.
Performance Considerations
When working with multiple grid models, importing and processing data will take time. Understand how to limit the data involved in calculations, and consider a test run with a small number of realizations before using the full ensemble.
Consider setting the Sampling Resolution to coarse to improve performance. Note that this option will introduce some interpolation effects.
Click the Compute button in the Property Editor to start the computation.
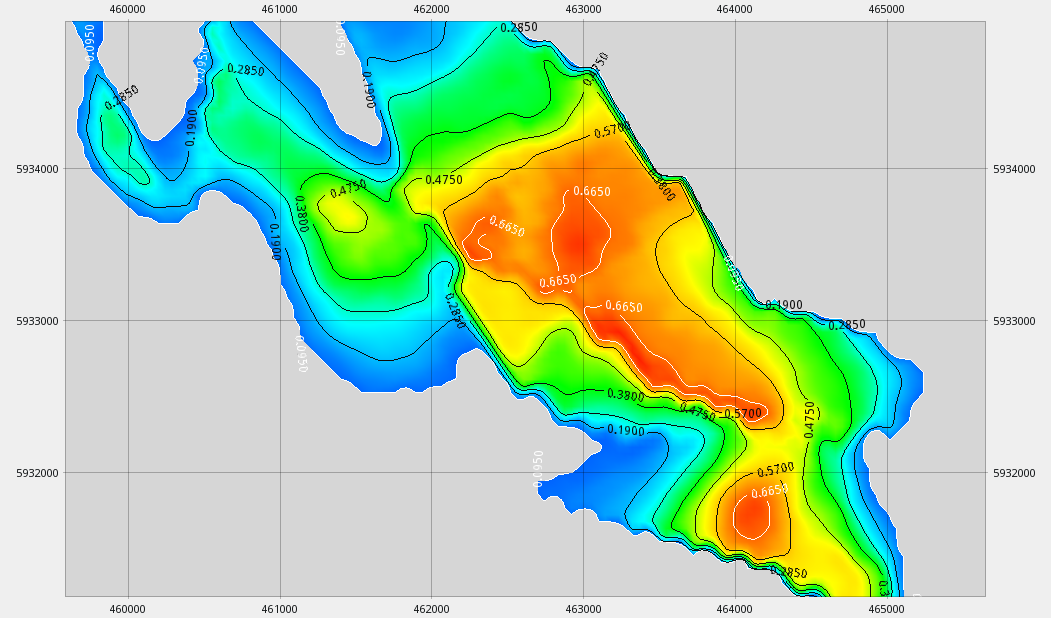
Display of Contour Map Data
A view is automatically created and displayed when the computation is completed. Select the Map Projection object to control the display. Create additional views from the right-click menu of the Ensemble Contour Map object.
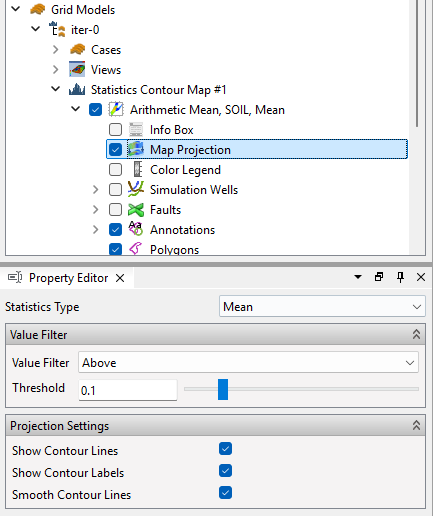
Select the current statistical property from Statistics Type. A value filter can be used to filter the display of the contour map.
Create Polygon
Select “Create Polygon from Contour Map” from the right-click menu. This will create a polygon of the outline of the contour map. The shape of the polygon can be simplified using the right-click menu of the generated polygon.