What's New in 2025.04
Ensemble Contour Map
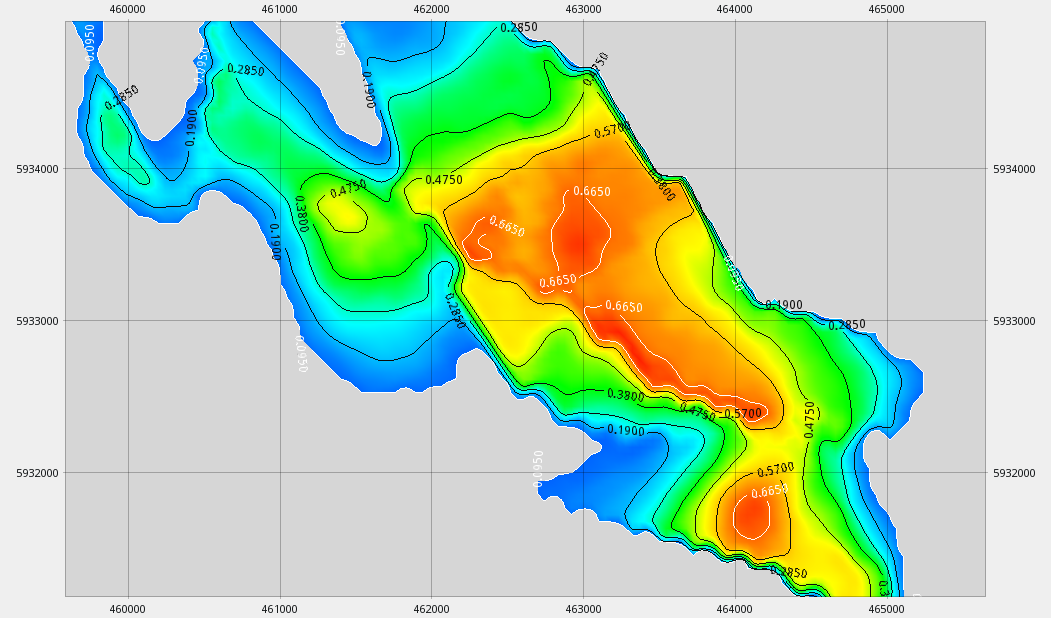
ResInsight can create contour maps from an ensemble of grid models based on different forms of aggregation of 3D Eclipse data onto a 2D plane. The grid models can have varying grid geometry. Mobile Oil/Gas/Hydrocarbon Column is now supported.
When a contour map is created, outline polygons of visible areas can be created.
Video Tutorial: Ensemble Contour Map
Well Target Mapping
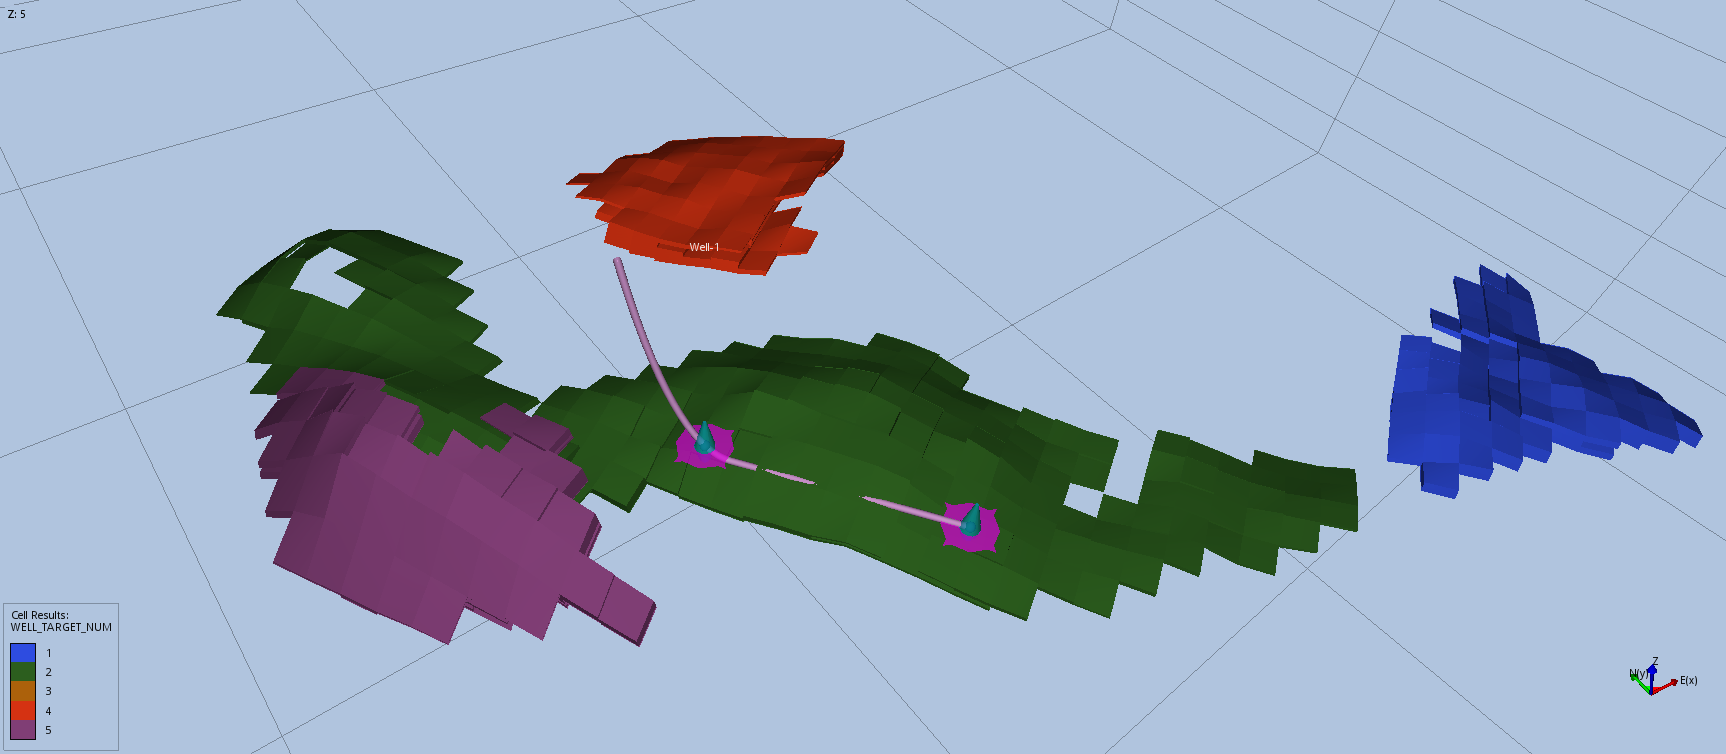
Automatically identify new well target candidates by identifying connected cluster of cells based on user defined threshold values.
Video Tutorial: Well Target Mapping
Ensemble Import Dialog
When multiple ensembles are displayed, it is a single click operation to select an ensemble. It is supported to select a range of cases based on realization number.
Summary Management
Improved automatic naming of ensembles. When multiple ensembles are imported, required text from the path is used to make the ensemble name unique. The summary type Connection is now supported.
Selection of Cells in 3D View
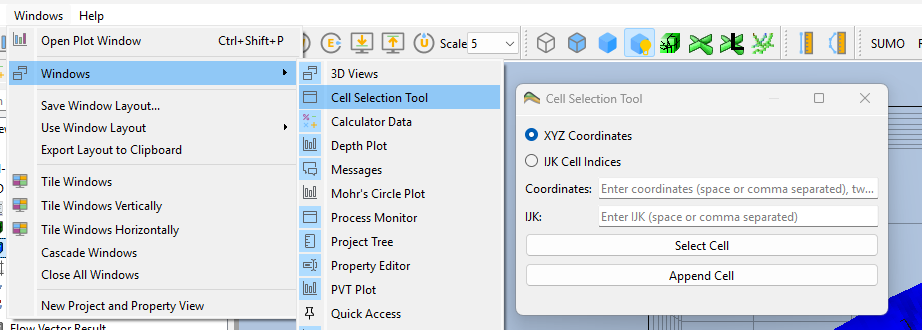
Selection of cells can now be done by entering IJK or a UTM coordinate. This feature is available from the Windows menu, Cell Selection Tool.
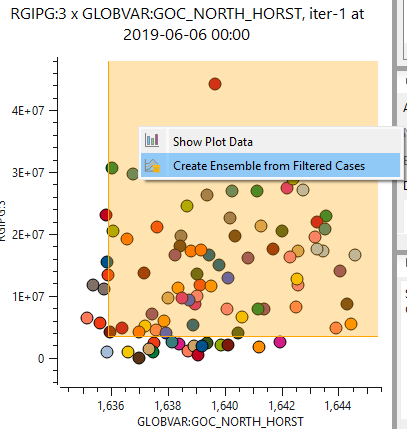
Correlation Cross Plot Filter
A filter on x and y axis can be defined for a correlation cross plot. The realization matching the filter can be used to create a new ensemble. This option is available on the right-click menu of a correlation plot.
Store User Defined View
A User Defined View can be stored and applied to other views, available from the View menu.
Mouse cursor Readout in Summary Plots
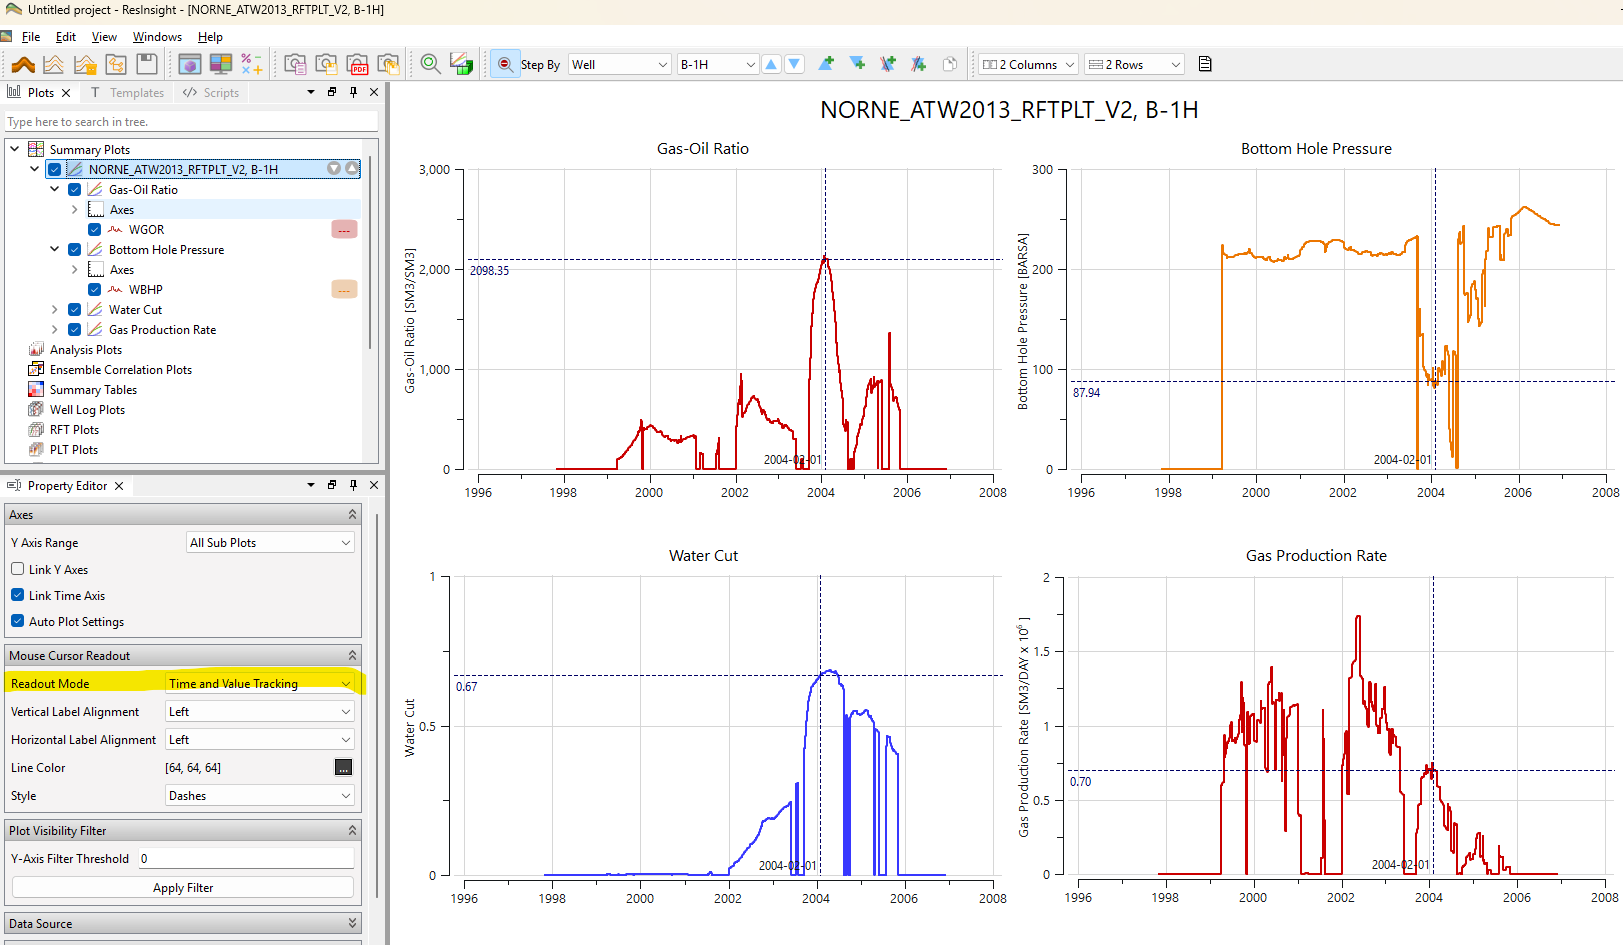
A vertical dotted line can be displayed at the mouse cursor in multiple plots indicating the current mouse position on the time axis. If a curve is selected, a dotted line can be displayed at curve value for selected time. This will enable readout of multiple values at the same time for a specified time.
Selection of Realization
When clicking on a curve in an ensemble, all curves connected to the selected realization will be highlighted. The summary case is also selected in the Property Editor. Selection of a realization object in the Property Editor will highlight curves. Multiselect is supported.
Curve Stepping
The data source for curves can be manipulated using the toolbar. The values in the drop-down is simplified make the user interface easier to work with. When stepping a vector, history and difference vectors will also change.
Other improvements
- Improved authentication dialog for cloud services
- Reorganized display of summary vectors into categories Completions and Connection
- Improved management of lumped connection vectors
- Support calculation of summary completions and connections
- Correlation plot is improved for readability and user experience
Python API
- Added support for fishbones completions
See Release Notes on GitHub for further details and information.