Simple class for profiling of computational tasks. More...
#include <Profiler.h>
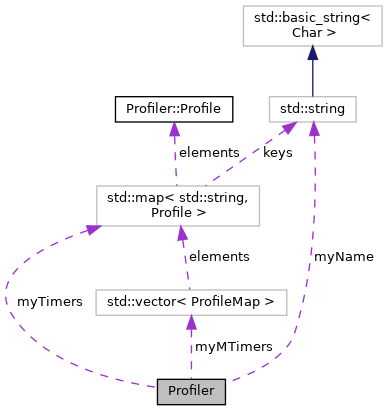
Classes | |
| struct | Profile |
| Stores profiling data for one computational task. More... | |
Public Member Functions | |
| Profiler (const std::string &name, bool doReport=true) | |
| The constructor initializes the profiler object. More... | |
| ~Profiler () | |
| The destructor prints the profiling report to the console, if autoReport is true. | |
| void | start (const std::string &funcName) |
| Starts profiling of task funcName and increments nRunners. | |
| void | stop (const std::string &funcName) |
| Stops profiling of task funcName and decrements nRunners. | |
| template<class Stream > | |
| void | report (Stream &os) const |
| Prints a profiling report for all tasks that have been measured. | |
| void | clear () |
| Clears the profiler. | |
Static Public Attributes | |
| static bool | indentReport = false |
| If true, indicate task level by indent. | |
Private Types | |
| using | ProfileMap = std::map< std::string, Profile > |
| Map of profilers. | |
Private Attributes | |
| std::string | myName |
| Name of this profiler. | |
| bool | autoReport |
| Whether or not to report results on program exit. | |
| ProfileMap | myTimers |
| The task profiles with names. | |
| std::vector< ProfileMap > | myMTimers |
| Task profiles with names and thread iD. | |
| double | allCPU |
| Accumulated CPU time from all "main" tasks. | |
| double | allWall |
| Accumulated wall clock time of all "main" tasks. | |
| int | nRunners |
| Number of tasks currently running. More... | |
Friends | |
| std::ostream & | operator<< (std::ostream &os, const Profile &p) |
| Global stream operator printing a Profile instance. | |
Detailed Description
Simple class for profiling of computational tasks.
The profiler measures the CPU time and the wall clock time for computational tasks identified be the user. Each task may be invoked an arbitrary number of times, and the average time consumption is then also recorded along with the number of invokations.
The profiling results are printed in a nicely formatted table when the profiler object goes out of scope, typically at the end of the program.
Constructor & Destructor Documentation
◆ Profiler()
|
explicit |
The constructor initializes the profiler object.
- Parameters
-
[in] name Program name to be printed in the profiling report header [in] doReport Automatically report results on program exit
The constructor also updates the global static pointer utl::profiler to point to *this, deleting any already pointed-to object first. This means, only one Profiler object can exist at any time.
References allCPU, allWall, LinAlgInit::increfs(), myMTimers, utl::profiler, and start().
Member Data Documentation
◆ nRunners
|
private |
Number of tasks currently running.
When nRunners is 1, we are only measuring the total time. When nRunners is 2, we are also measuring a "main" task, which total time is subtracted from the measured total time to find the reminder of all tasks that are not being measured. When nRunners is 3 or larger, the measured task is already included in another "main" task, and therefore its time is not included when calculating the "other" times.
The documentation for this class was generated from the following files:
- src/Utility/Profiler.h
- src/Utility/Profiler.C