Summary Plot Manager
The Summary Plot Manager is a separate ResInsight dialog window where the user can select which vectors to plot in a summary plot. This dialog is intended to be used from the keyboard with easy access to operations for management of summary plots. This dialog can be opened by using CTRL-K from anywhere in the Plot Window.
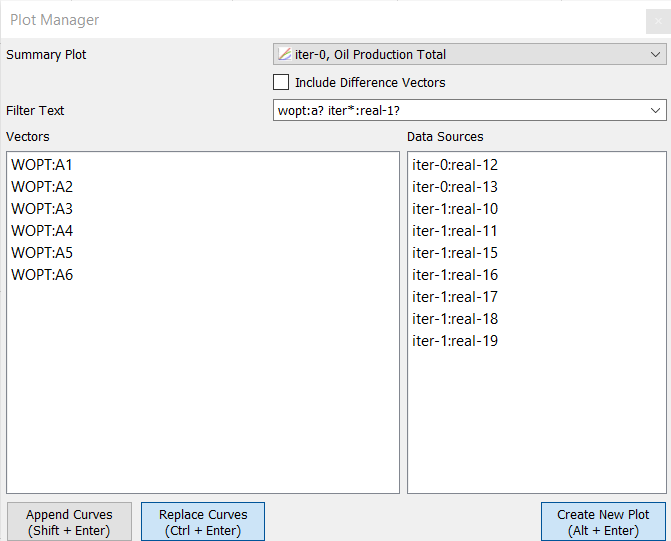
The user writes a text string defining the summary vectors and optionally data sources for curves to be plotted. Example: wopt:A? iter*. This text string will filter all WOPT vectors for wells with two characters where the first character is A. Additionally, this will filter select ensemble datasources starting with the string iter
ResInsight will automatically compupte the difference between a simulated and observed vector if both are available (WOPT/WOPTH). This will be displayed as WOPT_DIFF. These difference vectors can be included in the filter if the Include Difference Vectors is checked.
The resulting vectors and data sources are displayed in the corresponding lists below the filter text.
When the intended vectors and data sources is defined, the currently selected summary plot can be updated using buttons Append Curve or Replace Curves. Press button Create New Plot to create a new plot.
Keyboard shortcuts
| Operation | Shortcut |
|---|---|
| Display Summary Manager | CTRL-K |
| Append Curves | SHIFT-Enter |
| Replace Curves | CTRL-Enter |
| Create New Plot | ALT-Enter |
Filter text examples
| Filter Text | Description |
|---|---|
| wop* | All vectors starting with WOP for all wells |
| wopt:* | WOPT for all wells |
| wopt:a* | WOPT for all wells starting with character A |
| *opt* | All vectors having opt as a sub string (FOPT, FOPR, GOPT, GOPR, WOPT, WOPR, …) |
| wopt:* real-1? | WOPT for all wells for all realizations starting with text real-1 and one additional character |
| wopt:* iter-* | WOPT for all wells for all ensembles starting with text iter-1 and one additional character |
| wopt:* iter-1:real-2* | WOPT for all wells for all realizations starting with text iter-1:real-2 |