Data Sources
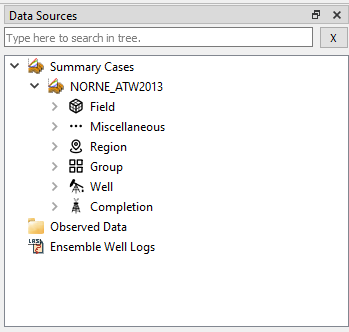
Data Sources provides an overview of all data sources for summary plots by category to provide search, selection, and essential functionality pertinent to summary cases.
As seen above, Data Sources enables search and sourcing of data from case, field, regions, wells, groups, or ensemble. See Summary Plots which illustrates use of Data Sources for effective search and selection of data for summary plots.
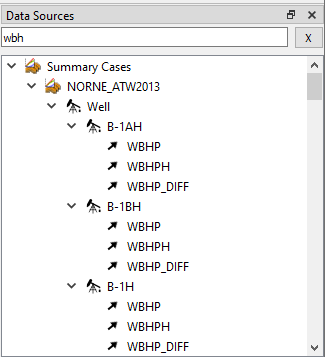
Searching for data sources
Atop the Data Sources window, there is a search field for effective searches across all available data sources. As exemplified below, typing just a few letters initiates a search for vectors prefixed by wbh across all data groups listing all hits.
Summary Cases functionality
Right-clicking the Summary Cases entry in Data Sources displays the functionality pertinent to summary cases.
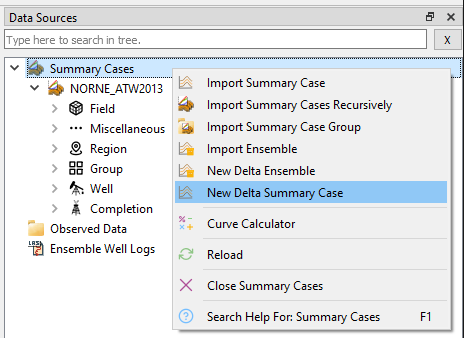
Delta Summary Case and Delta Ensemble
A Delta Summary Case or Delta Ensemble can be created as either the sum or difference between two existing summary cases or ensembles, respectively.
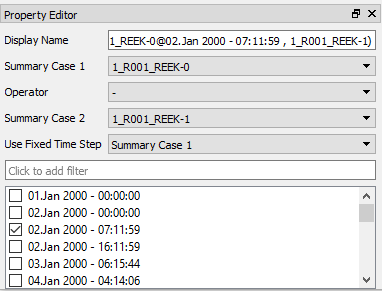
To create a delta summary case, for instance, right click and select New Delta Summary Case. The Property Editor for the new delta case allows to modify display name, the two base summary cases, and the arithmetic operator. In addition, it is possible to specify a specific time step to be used in delta computation. As exemplified below, the delta computation between two cases for a given parameter, e.g. WBHP, will be: $$WBHP_{delta}(t) = WBHP_{case1}(@02.01.2000) - WBHP_{case2}(t)$$ An existing delta summary case may be input to a new delta summary case.
Curve calculator
The Curve Calculator is a tool to perform vector calculations on a set of curves. The created curves can be stored for later use.
Summary Case functionality
Right-clicking a specific Summary Case in Data Sources displays the functionality pertinent to a single summary case.
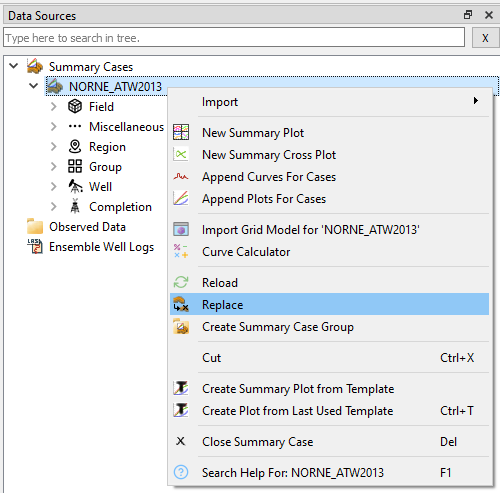
The highlighted menu item, right-clicking a summary case in Data Sources and select Replace will redisplay all configured plots with data from another case.
Please also note the menu options to create summary plot from Template which is a powerful and effective way to create summary plots with a specific appearance and content. When invoking a well-specific template on Summary Case level as shown above, the convention is that ResInsight selects the first well listed under
 as data source.