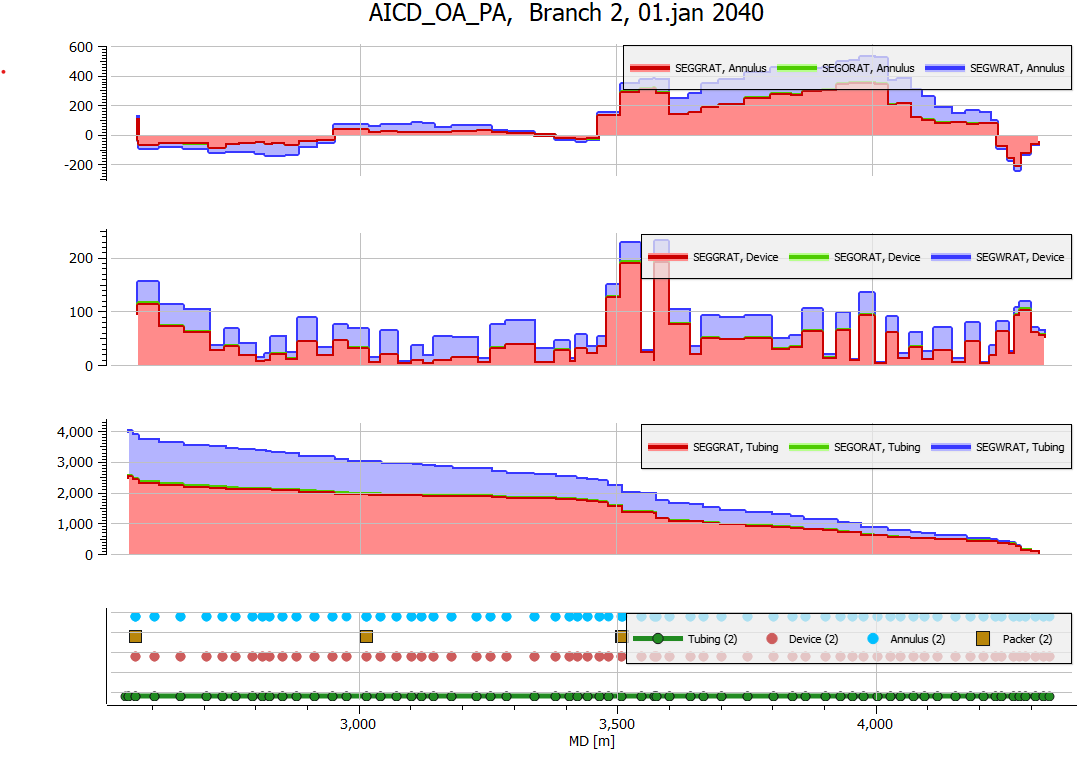
RFT Segment Plot
RFT Segment Data can be plotted as horizontal Well Log Plots. RFT data can be imported based on a summary case or a grid case.
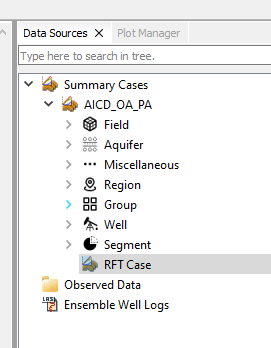
Create RFT Segment Plot
Open a summary case with RFT data
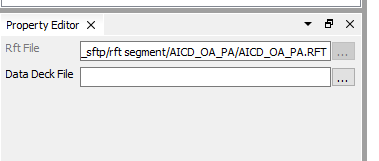
Additional data from WSEGLINK
Some cases require data from WSEGLINK keyword. When importing summary data, ResInsight will automatically search for the related *.DATA file. The identified file can be seen or changed from the Property Editor.
Create Default Plot
From the right-click menu of the RFT Case object , select Create RFT Segment Plot or Create RFT Multi Phase Segment Plot
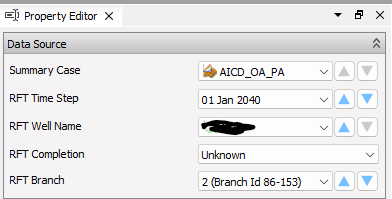
Select the generated Well Log Plot. Adjust the data source to desired well or branch. These settings are also available from the toolbar above the plot. Useful options to adjust for a curve is color, line style and area fill.
Additional settings and adjustments
General
- Select the plot, and use Data Source to change wells, dates and branch numbers
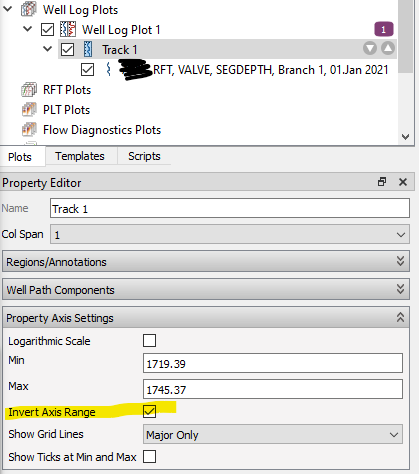
- If TVD depth is plotted, optionally invert the Y-axis when the track is selected
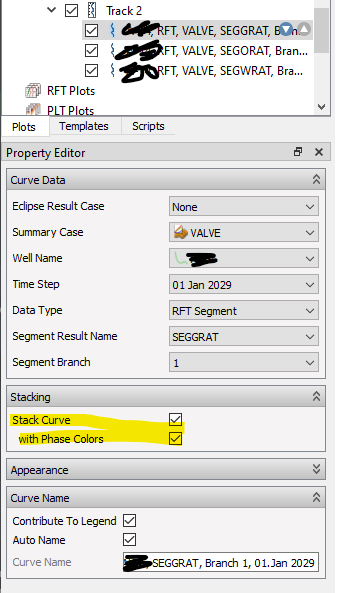
- Add more tracks with to the same plot, and use copy/paste of a track for fast duplication. Stacking can be used when plotting curves for multiple phases.
Axis and legend settings
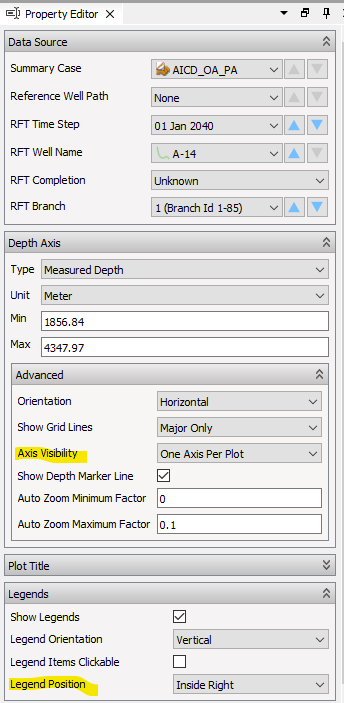
- Control if the depth axis should be visible for a single or all track from Axis Visibility.
- Use the Plot Title group to adjust the text of the title. Define a Template Text for full flexibility. Available variable names can be seen when hoovering over the Template Text label.
- Define where the location of curve legend using the Legend Position control.
RFT keywords and branch construction
For each well and report date in the RFT file, ResInsight reads a set of keywords that describe the multi-segment well topology and any per-connection results. These keywords are combined with WSEGLINK data from the companion DATA file to classify segments into tubing, device, and annulus branches.
Keywords read from RFT files
Segment topology – describes how segments connect and which branch they belong to:
SEGNXT– segment number of the next segment toward the wellhead for each segmentSEGBRNO– branch number that each segment belongs toBRNST– start segment number for each branchBRNEN– end segment number for each branchSEGLENST– measured depth at the start of each segmentSEGLENEN– measured depth at the end of each segment
Connection data – maps segments to grid cells and exposes connection-level results:
CONIPOS,CONJPOS,CONKPOS– I, J, K grid cell index of each connectionCONBRNO– branch number of each connectionCONLENST,CONLENEN– measured depth at the start and end of each connectionCONFAC,CONKH– connection factor and Kh. Undefined values are replaced with zero so the curves remain readable.
Standard well log channels:
DEPTH(true vertical depth),PRESSURE,WRAT,ORAT,GRATSWAT,SOIL,SGAS. WhenSOILis not present in the file it is computed as1 - SWAT - SGAS.
In addition, WSEGLINK is parsed from the DATA file (not from the RFT file itself) to identify which segments belong to annulus branches.
Branch construction
A multi-segment well can have up to three branch layers per lateral, each sharing the same one-based branch index that you select in Data Source:
- Tubing branch – the innermost pipe
- Device branch – sits between the tubing branch and the annulus or reservoir; each device segment links to a tubing segment through
SEGNXT - Annulus branch – sits between the device branch and the reservoir; identified through WSEGLINK
The classification proceeds as follows:
- Read
SEGNXT,SEGBRNO,BRNST, andBRNEN. For each segment, derive its segment number: non-terminal segments use theSEGNXTvalue of the following row, while the last segment on a branch usesBRNEN. - Read
SEGLENSTandSEGLENEN, then group segments bySEGBRNOto form candidate branches and compute the measured-depth length of each one. - For every candidate branch:
- If any of its segment numbers appear in the WSEGLINK annulus list, classify the branch as annulus.
- Otherwise, if the branch is longer than 1.0 m, classify it as tubing and assign the next one-based branch index.
- If no WSEGLINK data is available, fall back to comparing the last
SEGLENSTof pairs of tubing-classified branches. When the difference matches the expected tubing-to-annulus offset (~0.1 m), the offset branch is reclassified as annulus. - Renumber the tubing branch indices so each tubing, device, and annulus triplet shares a single contiguous one-based branch index.
- For any segment whose branch is not yet tubing but whose
SEGNXTpoints to a segment on a tubing branch, mark it and its connected unassigned segments as the device branch for that tubing branch index. - Annulus branches inherit the branch index of the device branch they connect to by following
SEGNXTfrom the first annulus segment to a device segment.
The resulting Branch Index and Branch Type are what the toolbar and Data Source use when stepping through branches on the plot.