Histogram Plots
Histogram Plots provide a graphical representation of the distribution of data values, making it easy to analyze the frequency and spread of results from various sources in ResInsight.
Data Sources
Histogram Plots can be generated from several types of data in ResInsight:
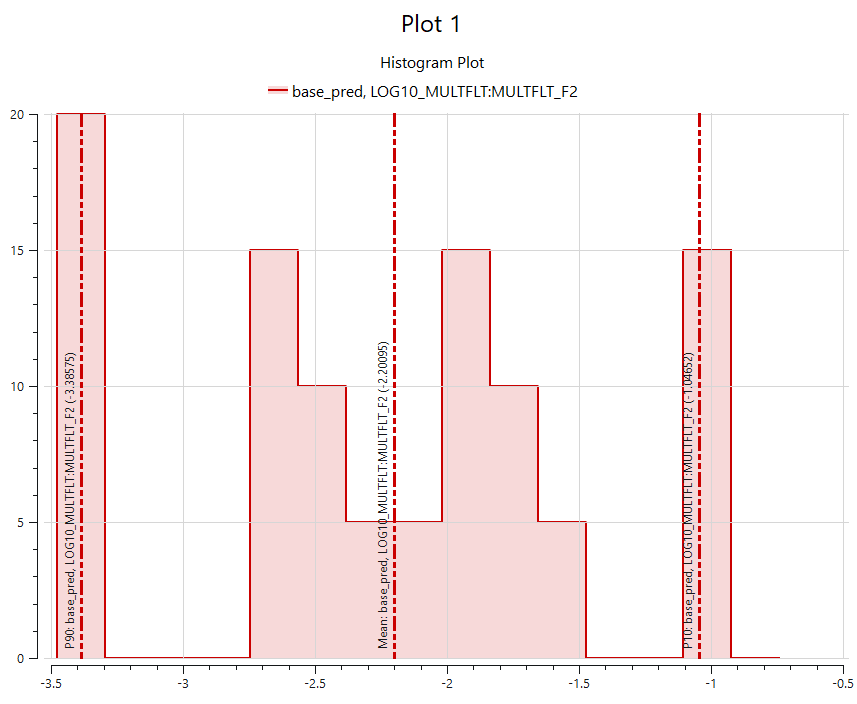
Summary Vector
Shows the distribution of summary vector values, such as production rates or pressures, at a specific timestep across all cases or realizations. This helps in understanding the variability and central tendency of key summary results.
Ensemble Parameter
Displays the distribution of parameter values across all realizations in an ensemble. This is useful for visualizing the spread and variability of input parameters used in ensemble simulations.
Grid Cell Values
Visualizes the distribution of property values (e.g., porosity, saturation) for all grid cells in a selected case. This is valuable for identifying patterns, outliers, or the overall range of property values within the reservoir model.
This histogram plot can also be created from the right-click menu in a 3D view.
Filter by 3d View Visibility
If you want to display the statistics for a subset of cells, you can select a view to use only the cells visible in that view. This option is activated by selecting a view from the drop down list at Filter by 3d View Visibility
Ensemble Fracture Statistics
Presents the distribution of statistical measures (such as mean, P10, P50, P90) calculated from ensemble fractures.
Creating a Histogram Plot
To create a Histogram Plot, right-click on Histogram object in Plot Project Tree and select New Histogram Plot. The plot will be added under the Histogram Plots section.
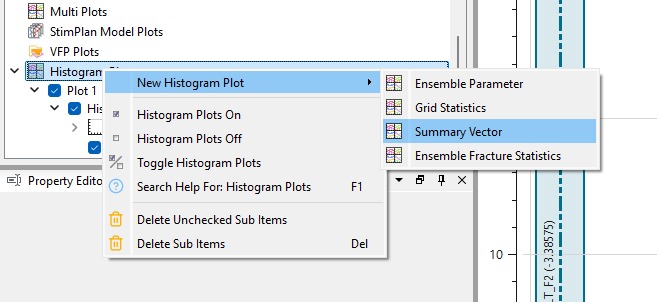
Histogram plots can also be created from the right-click menu of summary plots and ensemble parameter plots.