Well Allocation Over Time Plot
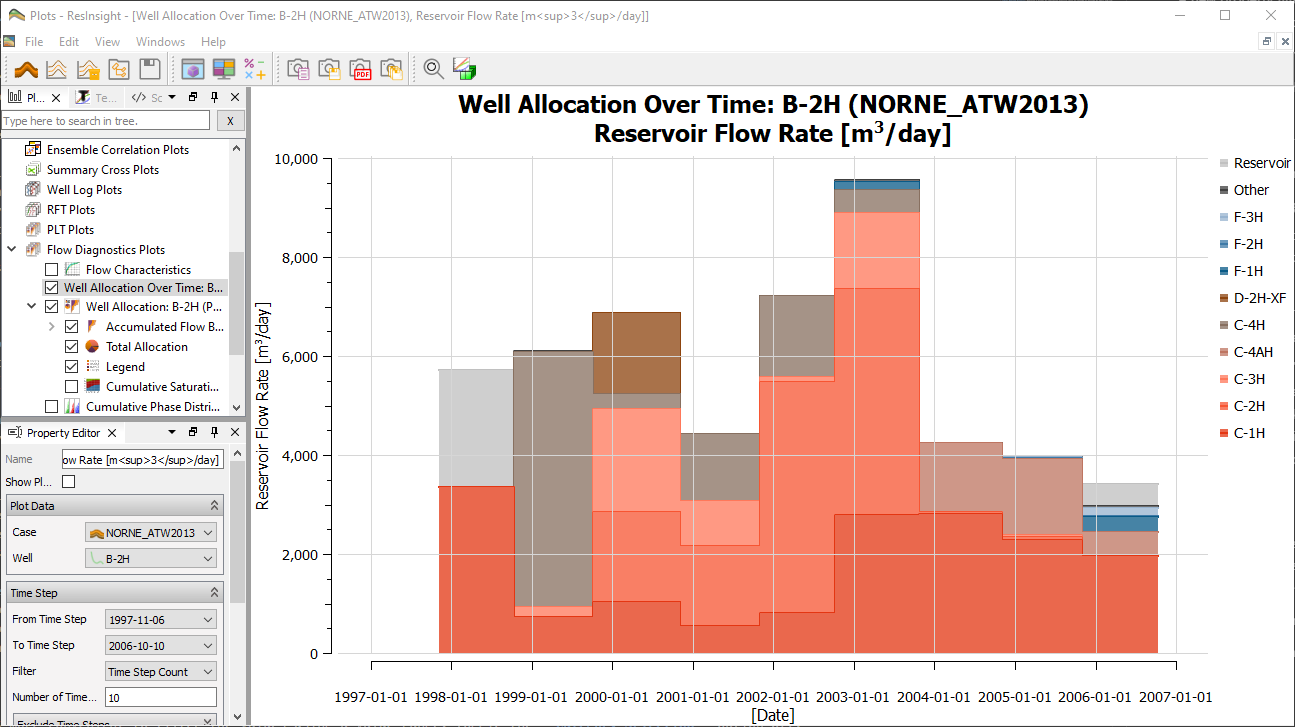
Well Allocation Over Time Plot is a plot displaying the flow data of Well Allocation Plots over a range of time steps. The plot provides the union of wells existing across all time steps for the selected case.
The plot utilize the Flow Diagnostics to provide an overview of which well or phase contributes most to the flow in a selected well. One can e.g. see which injectors are contributing to production of a producing well, and vice versa, over the selected time step range. The plot can be configured with a From and To time step to create the defined time step range. One can either utilize all time steps in the defined range, or one can down sample the date resolution by defining a number of time steps to utilize. Specific time steps flow values can be excluded by selection - the flow rate value for next time step is then utilized for calculations for excluded time step.
The Plot Type can either be Allocation or Well Flow. Allocation shows flow data for wells contributing to the flow of the selected Well, whereas Well Flow shows the flow data for contributing phases (Oil, Water and Gas) for the selected Well.
The data values are controlled by Value Type, where one can select between:
- Flow Rates - [$m^{3}/day$] The flow rate at each time step.
- Flow Rate percentage - [$\text{%}$] The flow rate contribution in percentage of total flow rate at each time step.
- Flow Volumes - [$m^{3}$] The flow volume between a time step and previous time step (flow rate multiplied with days between time steps).
- Accumulated Flow Volumes - [$m^{3}$] The flow volume accumulated for each time step.
- Accumulated Flow Volume Percentage - [$\text{%}$] The flow volume accumulated for each time step in percentage of total accumulated flow volume at time step.
Note that flow rates and flow volume is constant for a time step and back in time to previous time step in the selected time step range. Accumulated flow volume values are linear interpolated from the respective time step and to previous time step. Small contributors can be grouped into Other by enabling grouping and setting a Threshold value.
Further plot configuration is performed by use of the Property Editor, shown below.
Creating Well Allocation Over Time Plot
The Well Allocation Over Time Plot is a part of the Flow Diagnostics Plots. Click here for how to generate the plots from 3D view.
Editing Table
The settings for the Well Allocation Over Time Plot is listed in the Property Editor.
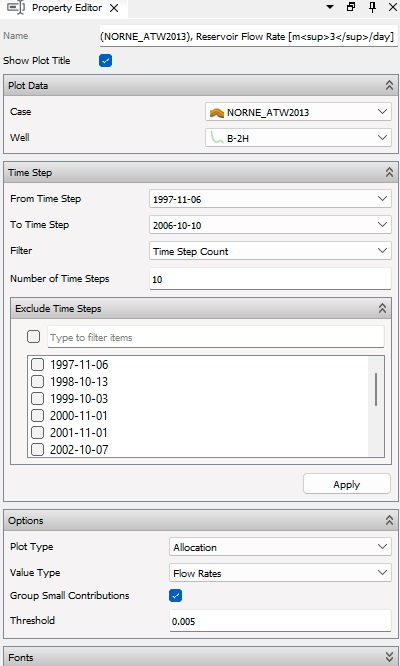
The main controls for a Well Allocation Over Time Plot is listed below:
Plot Data
- Case - Select case to retrieve data from.
- Well - Which case well to calculate Flow Diagnostics over time for.
Time Step
- From Time Step - Select time step to start range from.
- To Time Step - Select time step to end range on.
- Filter - Filter number of time steps to include: Show All Time Steps or Time Step Count.
- Number of Time Steps - Set number of time steps to include between From and To selection.
- Exclude Time Steps - Exclude specific time step if wanted (utilize flow rate value for next time step).
Options
- Plot Type - Select between Allocation or Well Flow.
- Value Type - Select between: Flow Rates, Flow Rate percentage, Flow Volumes, Accumulated Flow Volumes and Accumulated Flow Volume Percentage
- Group Small Contributions - Enable to group small contributors in category Other
- Threshold - [$0, 1$] Contributor values below threshold is grouped into category Other when grouping is enabled.