Ensemble RFT Plot
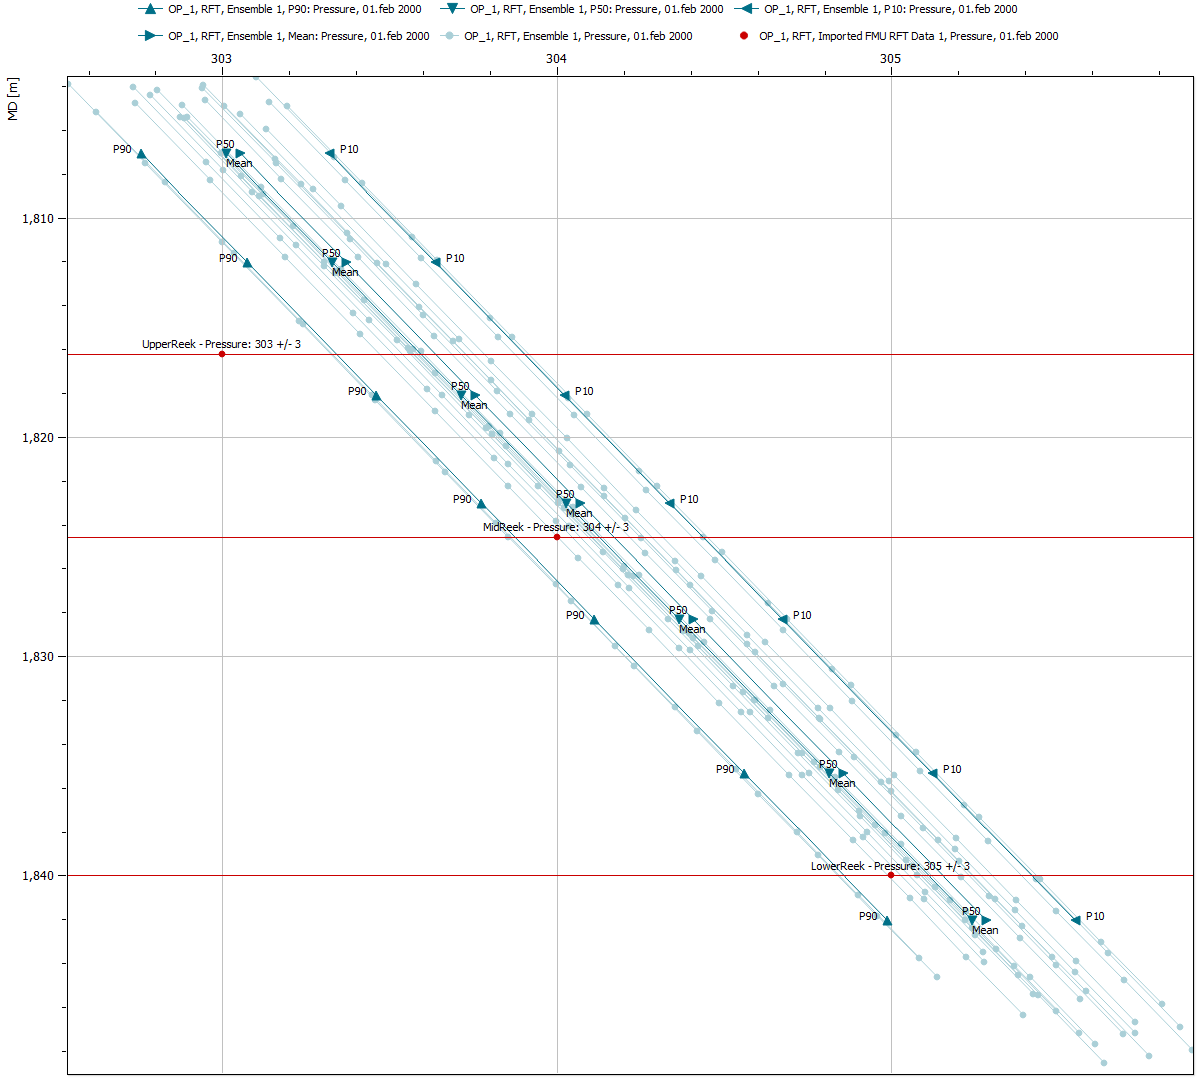
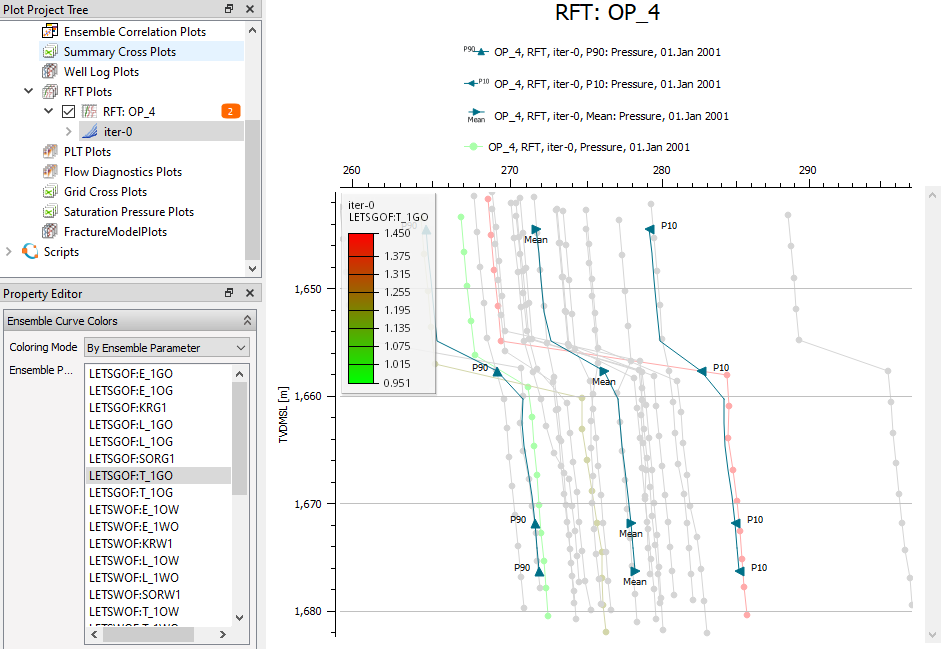
ResInsight allows the user to create a ensemble RFT plot similar to summary ensemble plots. The functionality also computes statistics, e.g. P10, P90, and mean. When possible, ResInsight avoids loading the grid when reading ensemble RFT data.
An ensemble RFT plot can also be used as the basis for an RFT Correlation Plot, which relates the RFT pressure response to the ensemble parameters.
Create New Ensemble RFT Plot
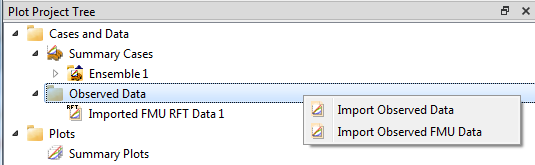
When a summary ensemble has been imported, observed FMU data can be imported via right-clicking Observed Data in the Plot Project Tree, and selecting Import Observed FMU Data.
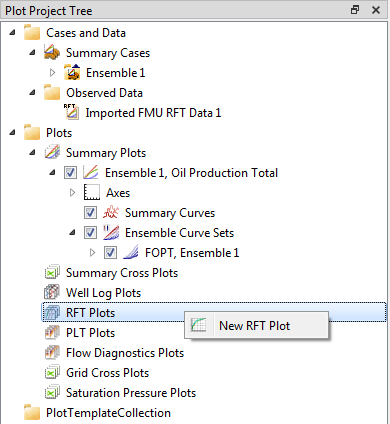
To create ensemble RFT plot, right-click RFT Plots and select New RFT Plot.
Property Editor
The property editor lets the user select which curves to display in the RFT plot.
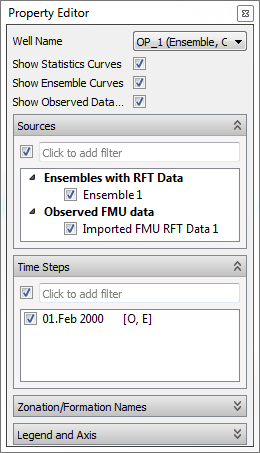
Well Name
Select the well to display in the plot. Wells postfixed by ’(Well Path)’ have an associated well trajectory loaded.
Sources
Subsequent to selecting a well in the Well Name field, the relevant sources for that well will appear in the Sources field. The sources for this particular case are:
- Ensembles with RFT Data – List of ensembles which contain RFT data with check-boxes to activate display.
- Observed FMU data – Observed data imported from a FMU run.
When the user selects one or more sources, a selection of their time steps appears in the Time Steps field.
Time Steps
The Time Steps field contains the relevant time steps according to the source selection. Time steps are deemed to be relevant by the following rules:
- If a single source or sources of the same type are selected, all available time steps in those sources are shown.
- If sources from two or tree types are selected, the time steps are filtered:
- The time steps matching the observed case(s) time steps.
- If no time steps from a case match the observed time step, the two adjacent ones are shown.
- The first time step from any grid case(s) (as initial pressure reference). If the Observed data isn’t selected, the RFT data serves as filter reference.
Each time step is postfixed by letter(s) to indicate source type(s) of each time step. The source types are indicated in square brackets:
- O – Time step has Observed data
- E – Time step has Ensemble data
- R – Time step has RFT data
- G – Time step has Grid data
More than one letter for one single time step, means that the time step comes from multiple case types.
Zonation/Formation Names
The display of formations lines is controlled in the same manner as for RFT plots. Please see the full documentation of the formations property editor for details about formations.
Legend and Axis
Visual properties of legend and axes is controlled in the same manner as for RFT plots.
Color by Ensemble Parameter
One ensemble parameter is selected to control coloring. The ensemble parameter value for each case is used to pick a color in a color range. In this case a color legend appears.
Import of Observed Ensemble RFT data from FMU
Observed RFT data as part of a FMU run is presupposed to be located in a folder which contains the following four file types:
- layer_zone_table.txt
- <well_name>.obs
- <well_name>.txt
- well_date_rft.txt
The purpose and format of the data files is explained below.
Note
The data file well_date_rft.txt is required. If missing, no Observed FMU data will be imported.
Correlation of grid and formations
The file layer_zone_table.txt can be used to correlate each grid k-layer with a formation name. This file is identical for all cases in the same ensemble.
Example file layer_zone_table.txt:
Observed pressure and error
For a given well name, the file <well_name>.obs is a data file containing two columns to specify observed pressure and error. Column one contains observed pressure and column two contains error. The observation data is valid for one and only one layer/formation.
Example file for well OP_1, i.e. OP_1.obs:
Observed pressure and error - multiple observations for a well
If there are multiple observations for a well at different dates, the naming of the files include a measurement ID
Example file well_date_rft.txt:
Measurement ID is the last column. The corresponding observations files are named as follows, the measurement ID is appended to the well name.
Reservoir zone name
For a given well name, the file <well_name>.txt is a data file containing five columns that specify its correlation with reservoir zones. Each line of data must contain:
- Utmx: x-coordinate in UTM
- Utmy: y-coordinate in UTM
- Measured Depth relative to the Kelly Bushing (MDRKB)
- True Vertical Depth referenced to Mean Sea Level (TVDMSL)
- Reservoir zone name
Example file for well OP_1, i.e. OP_1.txt:
Well measurements - date format 1
The data file well_date_rft.txt contains well measurements. The file contains four columns for each well measurement:
- Well Name
- Date in two digit form <DD>
- Month in two digit form <MM>
- Year in four digit form <YYYY>
- Measurement index
There can be multiple measurement for each well.
Example file well_date_rft.txt:
Well measurements - date format 2
The data file well_date_rft.txt contains well measurements. The file contains four columns for each well measurement:
- Well Name
- Date on the format <YYYY-MM-DD>
- Measurement index
There can be multiple measurement for each well.
Example file well_date_rft.txt: