Decline Curve Analysis
Create Decline Curves
Decline Curve Analysis (DCA) can be created by selecting Create Decline Curves from the right-click menu for a curve in the Plot Project Tree.
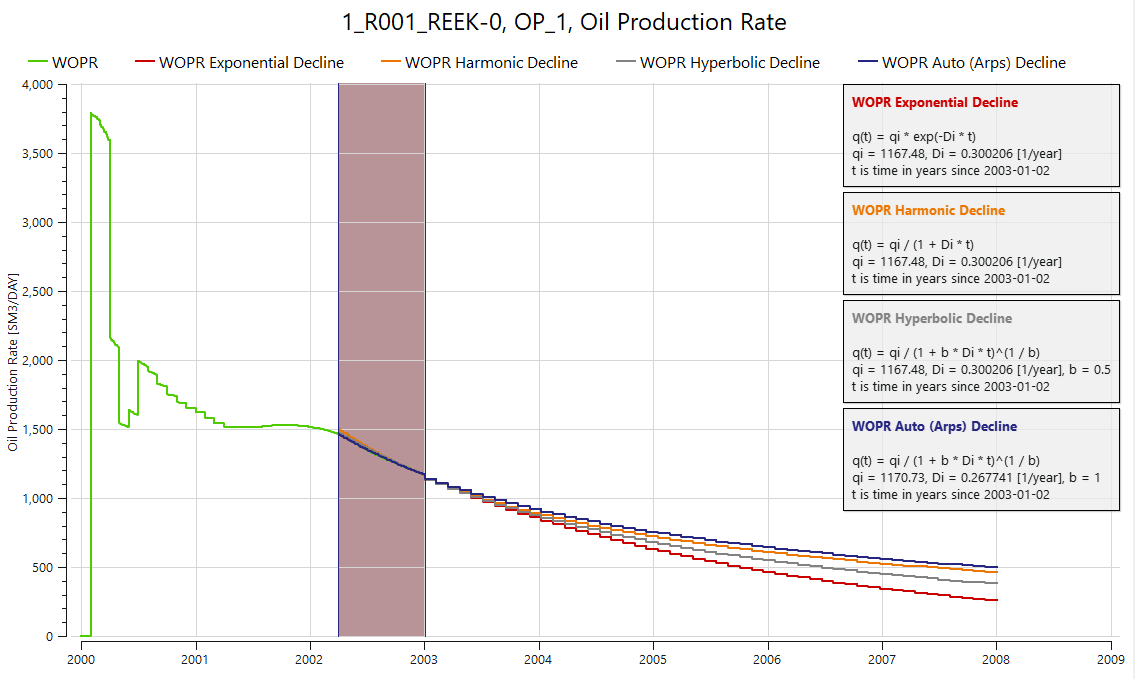
Three decline curves are created: exponential, hyperbolic and harmonic. Each curve gets a distinct color. The values for the decline curves can be inspected visually in the plot, and values can be displayed using Show Plot Data from the menu inside the plot window.

The decline parameters are estimated from the history values in the selected time range. The history part of a decline curve is a backward extrapolation of the decline equation, and the curve continues as a prediction after the last history time step.
Decline Curve Settings
Select a decline curve in the Plot Project Tree to edit it in the Property Editor.
Decline Curve
- Type – Exponential, Harmonic, Hyperbolic or Auto (Arps), see Auto (Arps) Decline
- Fit Method – How the decline parameters are estimated from the history values. Not used for Auto (Arps).
- Start and End Point – Match the equation to the first and last value in the time range
- Regression – Fit the equation to all history values in the time range
- Years – Number of years to predict after the last history time step
- Decline Constant – The constant $b$ for hyperbolic decline
- Equation – The equation and parameter values of the decline curve. The text can be copied.
- Show Equation In Plot – Show the equation in a text box in the plot
Time Selection
- From and To – The time range used to estimate the decline parameters. Enter a date, or use the sliders below the date fields.
- Show In Plot – Highlight the time range in the plot
Origins
J.J. Arps [1] concluded that the decline in oil production rate ($q_i$) over time can be described by these equations:
$$\frac{ 1 }{ q_0 } \frac{\partial q_0}{ \partial t} = -D$$
where the decline rate, $D$ is a time-dependent function:
$$D = \frac{D_i}{1+bD_i t}$$
where:
- $q_0$ is the production rate (e.g. oil production) in a unit of choice (e.g STB/day)
- $t$ is the time
- $D$ is the time dependent decline rate
- $D_i$ is the initial decline rate (constant)
- $b$ is a dimensionless constant (typically used as a tuning parameter to match actual field data) and is in the range of $ 0 <= b <= 1 $.
The equations can be used to forecast future reservoir and well production.
Based on the value of $b$ in the function, Arps classified the decline curves into three types:
- The exponential decline has $b = 0$.
- The harmonic decline has $b = 1$.
- The hyperbolic decline has $b$ ranges between 0 and 1.
It is important to note that the decline curve is an empirical model and assumes a simplified representation of the complex physical and geological factors affecting production decline.
Rate-Time Decline Curves
Exponential Decline
Exponential decline is the production decline when $ b = 0 $. This gives a constant decline ($D_i = D$).
$$q_0 = q_i e^{-Dt }$$
Hyperbolic Decline
Hyperbolic decline is the generic case where $ 0 < b < 1 $.
$$q_0 = \frac{q_i}{ (1+bD_i t )^\frac{1}{b} }$$
Harmonic Decline
Harmonic decline is the production decline when $b = 1$:
$$q_0 = \frac{q_i}{ (1+D_i t ) }$$
Auto (Arps) Decline
For the Auto (Arps) type, the decline constant $b$ is estimated from the data together with $q_i$ and $D_i$. The fit uses the positive flow rates in the time range, starting at the peak rate to skip the ramp-up phase. For each value of $b$ between 0 and 1, $q_i$ and $D_i$ are found by minimizing the sum of squared relative errors between the equation and the flow rates. The value of $b$ giving the lowest error is used. For accumulated vectors, the flow rates are derived from the differences between the values.
The approach is similar to the AutoDCA tool [2].
Rate-Cumulative Production Decline Curves
Exponential Decline
Exponential decline is the production decline when $b = 0$. This gives a constant decline ($D_i = D$).
$$N_p = \frac{q_i - q_0}{D}$$
Hyperbolic Decline
Hyperbolic decline is the generic case where $ 0 < b < 1 $.
$$N_p = \frac{q_i^b}{D_i(1-b)} [q_i^{(1-b)} - q_0^{(1-b)}]$$
Harmonic Decline
Harmonic decline is the production decline when $ b = 1 $:
$$N_p = \frac{q_i}{ D_i } * \ln(\frac{q_i}{ q_0} )$$
Decline Rate
The continuous decline rate ($D_i$) can be determined from production history data. Using production rate and time data the value is the slope of the straight line on a semi-log plot. Taking two points on from the data $(t_1, q_1)$ and $(t_2, q_2)$:
$$D_i = \frac{1}{t_2 - t_1} \ln(\frac{q_1}{q_2})$$
where:
- $t_1$ is the time of the first point.
- $q_1$ is the production rate in the first point.
- $t_2$ is the time of the second point.
- $q_2$ is the production rate in the second point.
References
[1] Arps, J. J.: “Analysis of Decline Curves,” SPE-945228-G, Trans. of the AIME (1945)
[2] Equinor: Decline Curve Analysis, github.com/equinor/decline-curve-analysis