What's New in 2023.10
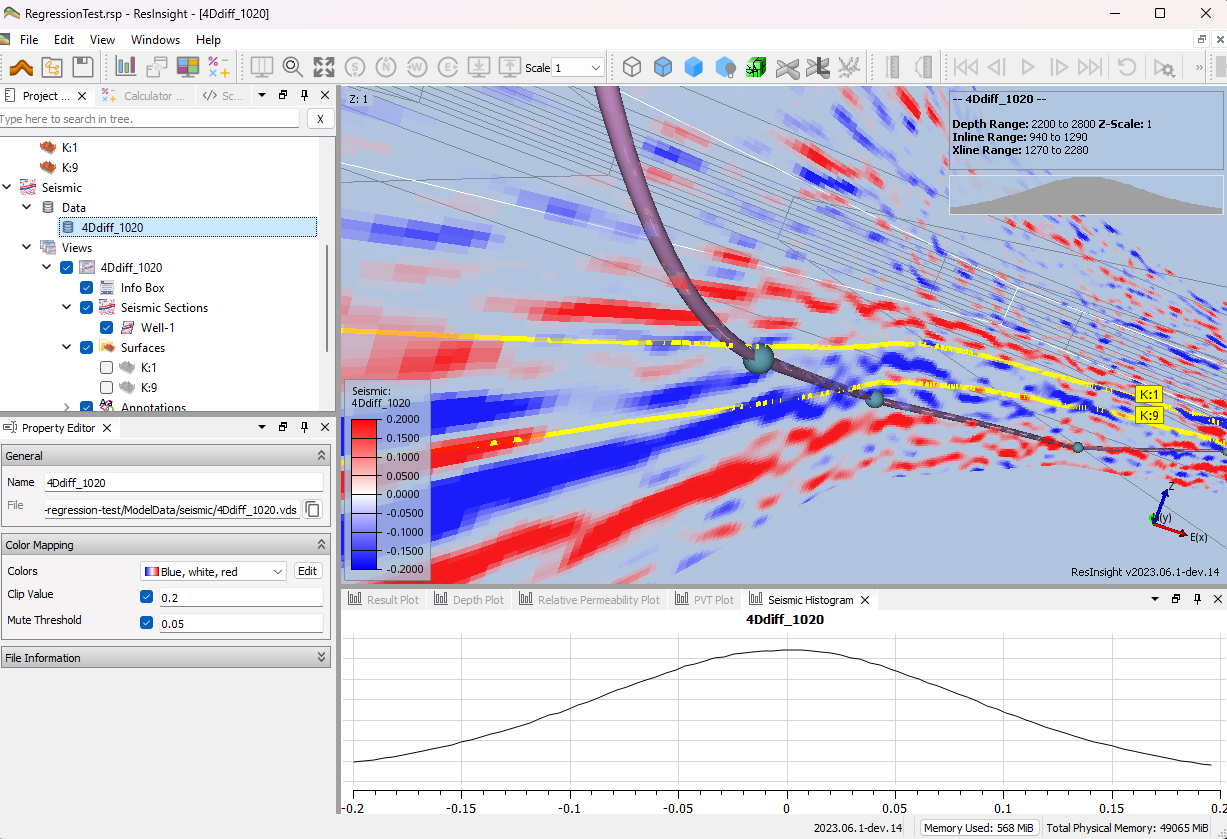
Seismic View

When working with seismic data, it is no longer required to have a grid model open. Import a seismic cube and surfaces, add some well paths and interact with seismic data.
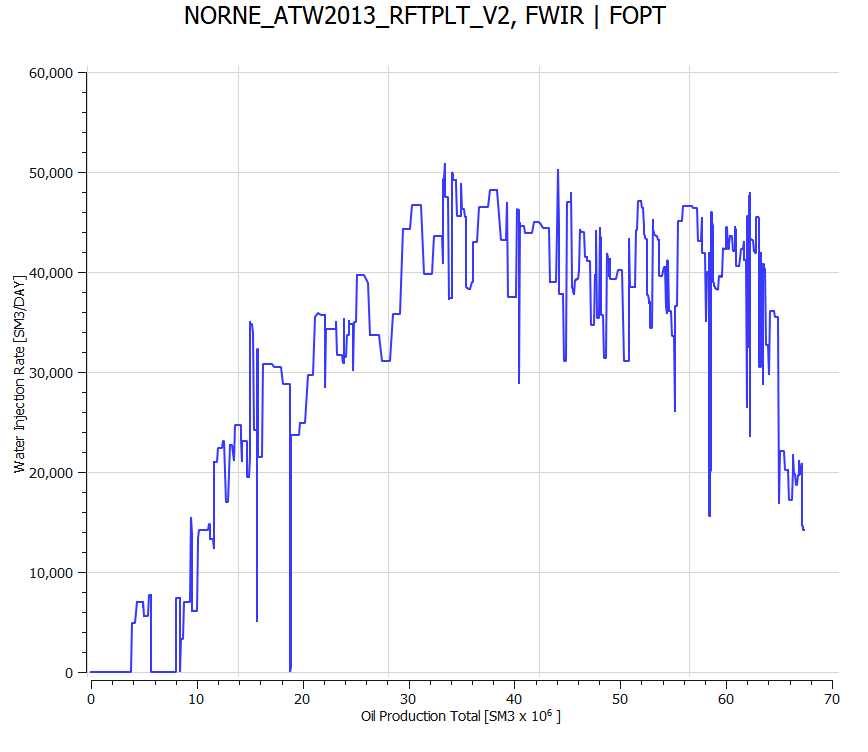
Summary Cross Plot Curves

Summary Cross Plot curves are now easily available as part of a summary plot. Cross plot of ensemble curves is now supported, and Regression Curves can be created on both single cross plot curves and ensemble statistics curves.
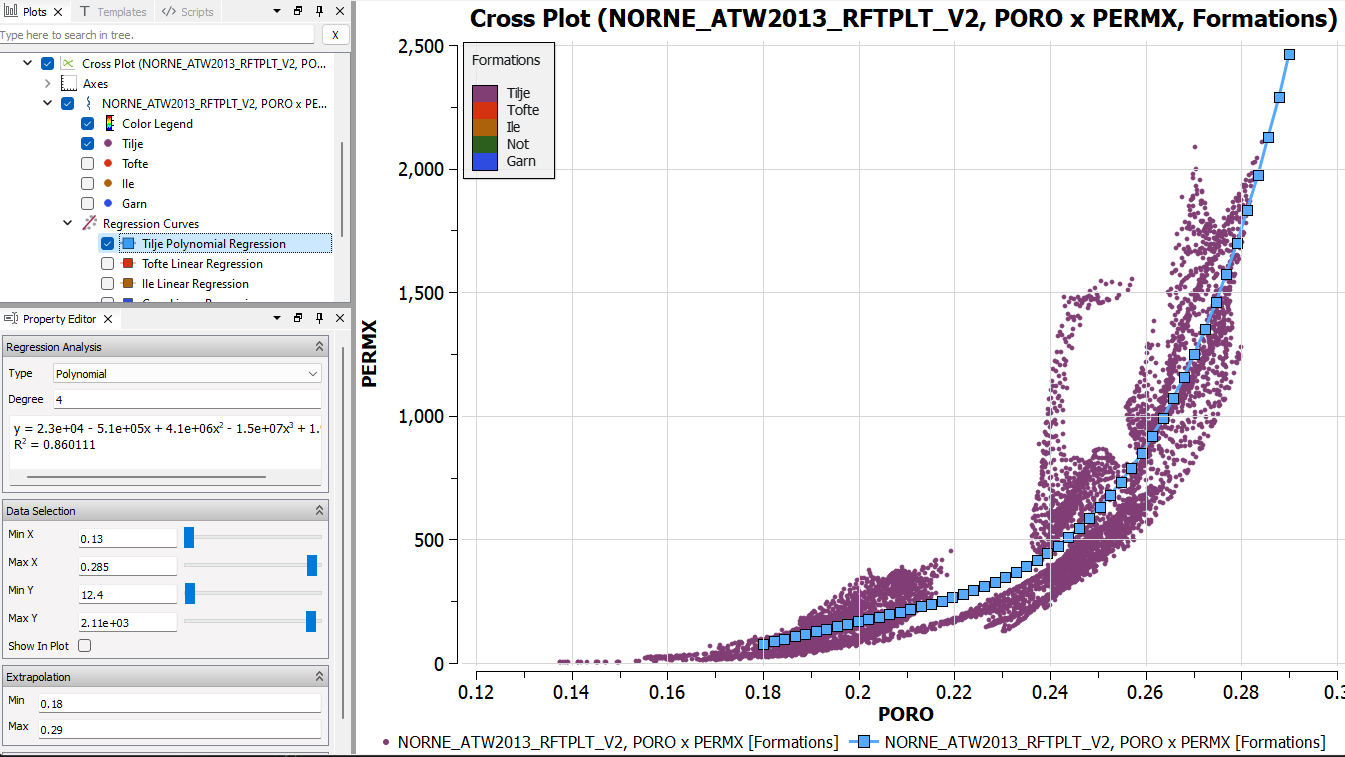
Regression Analysis for Grid Cross Plots

Grid Cross Plots have now support for display of regression curves.
Performance improvements
- Huge performance improvements for summary cases with many objects (wells, groups, regions, …)
- Using the Polygon Cell Filter is now performing much better
Stacking of Curves
- Fixed a crash when stacking was enabled
- Make sure all curves are visible when stacking is changed
- Improve performance when selecting multiple curves and toggle stacking state of all curves in one operation
Other improvements
- Valve Import is now supported from Completor and Eclipse schedule files.
- Add text export using Show Plot Data for Analysis Plots and Correlation Plots.
- Text labels can be visualized on surface intersection lines
- Ensemble RFT plots are improved to handle horizontal wells by using 3D grid model data
- Avoid setting curve color to full white when highlighting a curve
- Make sure summary data type Network is available in summary data source
- Duplicate a well path to a user-defined well path that can be manipulated - Well Path Duplication
See Release Notes on GitHub for further details and information.