What's New in 2023.06
Seismic Data
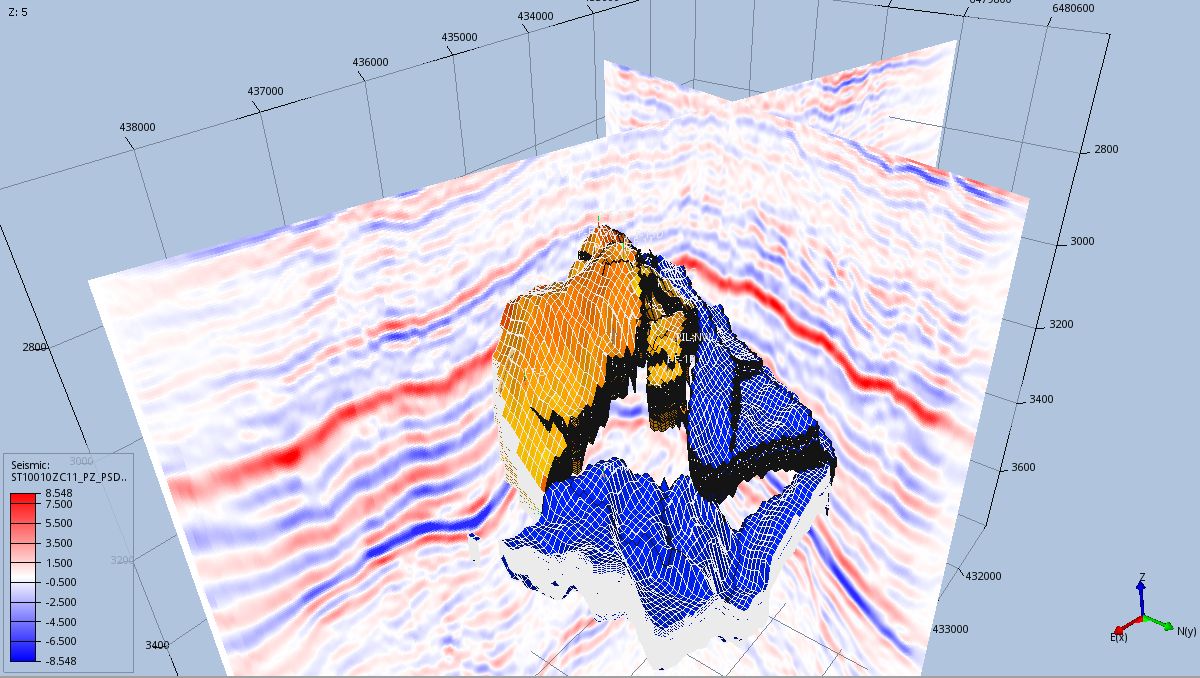
ResInsight supports the following seismic file formats:
- SEGY: file format developed by the Society of Exploration Geophysicists for storing geophysical data
- VDS: file format for fast random access to multi-dimensional volumetric data as supported by OSDU OpenVDS
- ZGY: file format for fast random access to multi-dimensional volumetric data as supported by OSDU OpenZGY
Summary Table
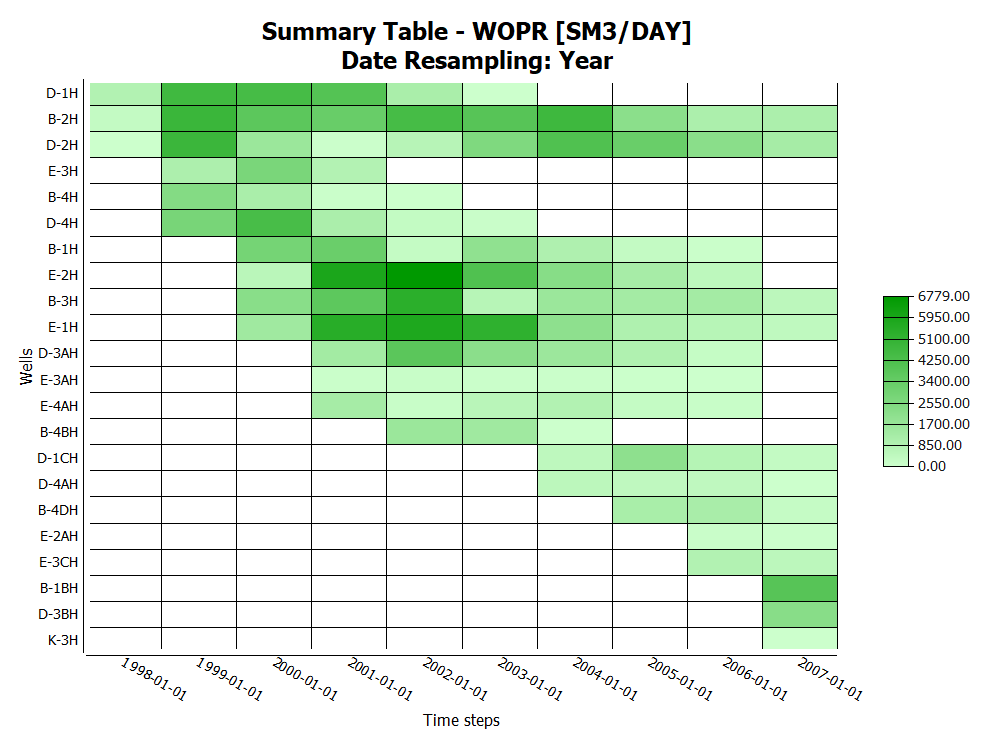
Summary Tables are a display of curve data based on Eclipse Summary Data as a color map in table format. It shows summary data of vectors for the selectable categories: Well, Group or Region.
Summary tables are displayed with the summary vectors on each row, and time step values according to selected Date Resampling in each column - as shown with resampling Year in the screenshot above.
Producer/Injector Connectivity Table
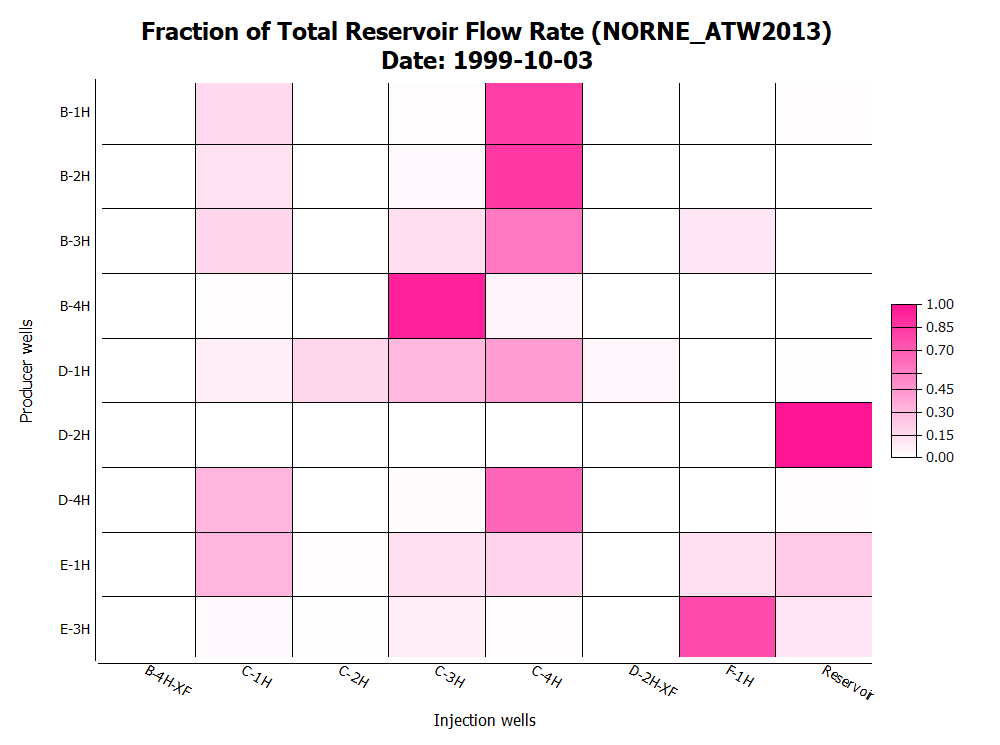
Producer/Injector Connectivity Tables is a display of Flow Diagnostics Data as a color map in table format. The table either shows flow rate data for a single time step, or accumulated flow volume data over a range of time steps.
Cell Filters for Faults and Intersections

Intersections and faults can now be visually filtered by using cell filters, and can be useful if faults and intersections obscure other interesting parts of the model. The filtering using cell filters is by default activated.
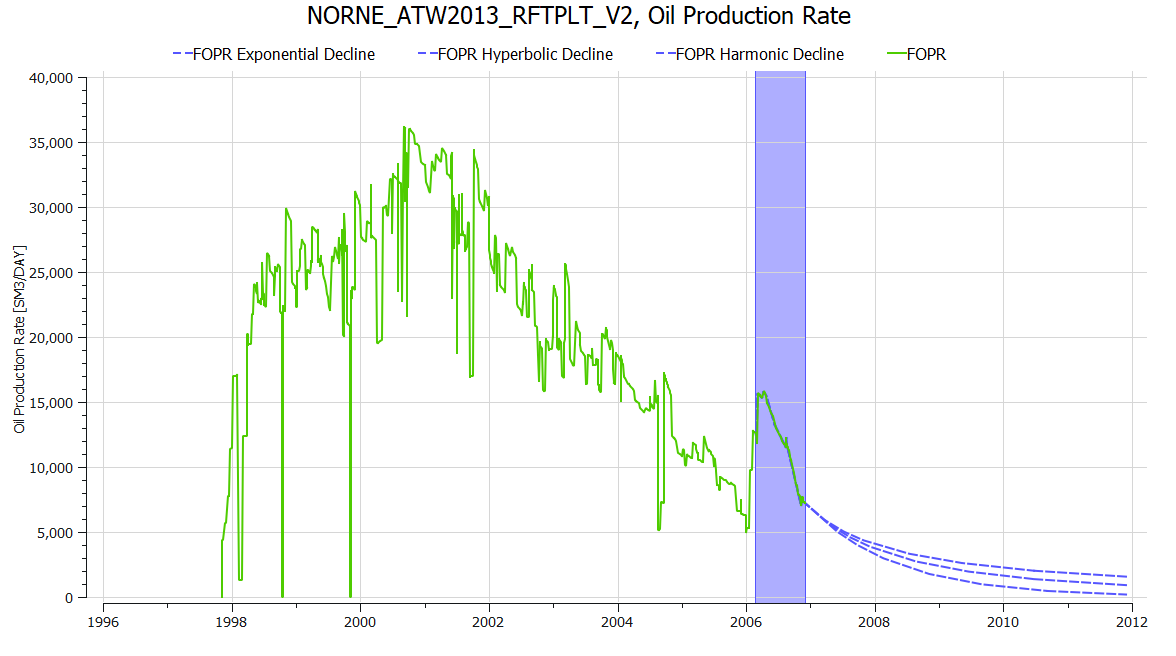
Regression Analysis and Decline Curve Analysis
Integer Cell Results
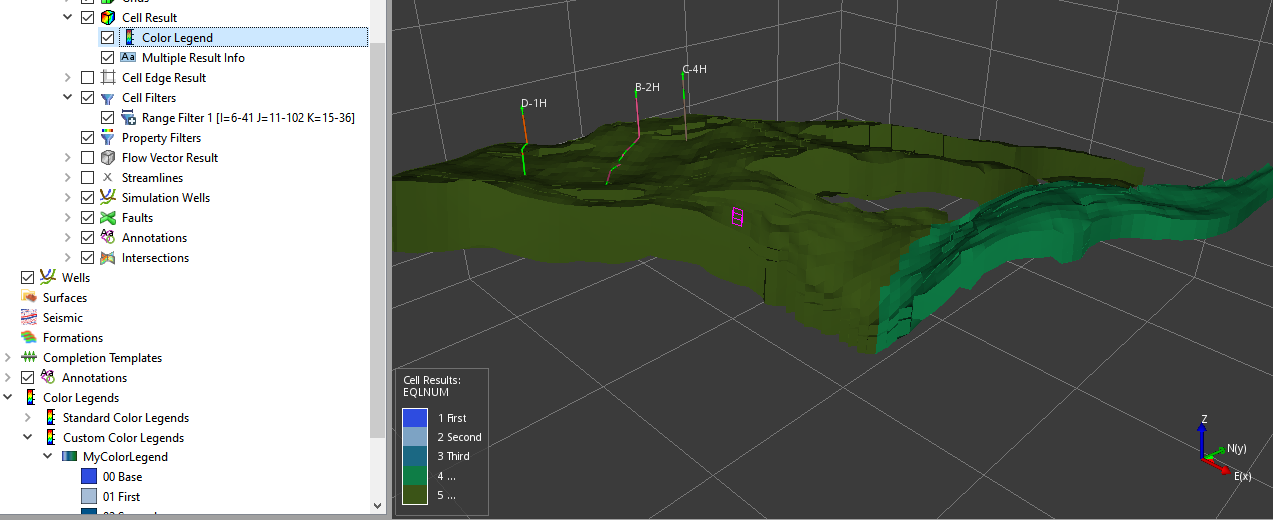
Integer Cell Results can now be visualized using Integer Color Legends and use custom color names that can be displayed in the 3D view.
Improved Visualisation of Ensemble Curves
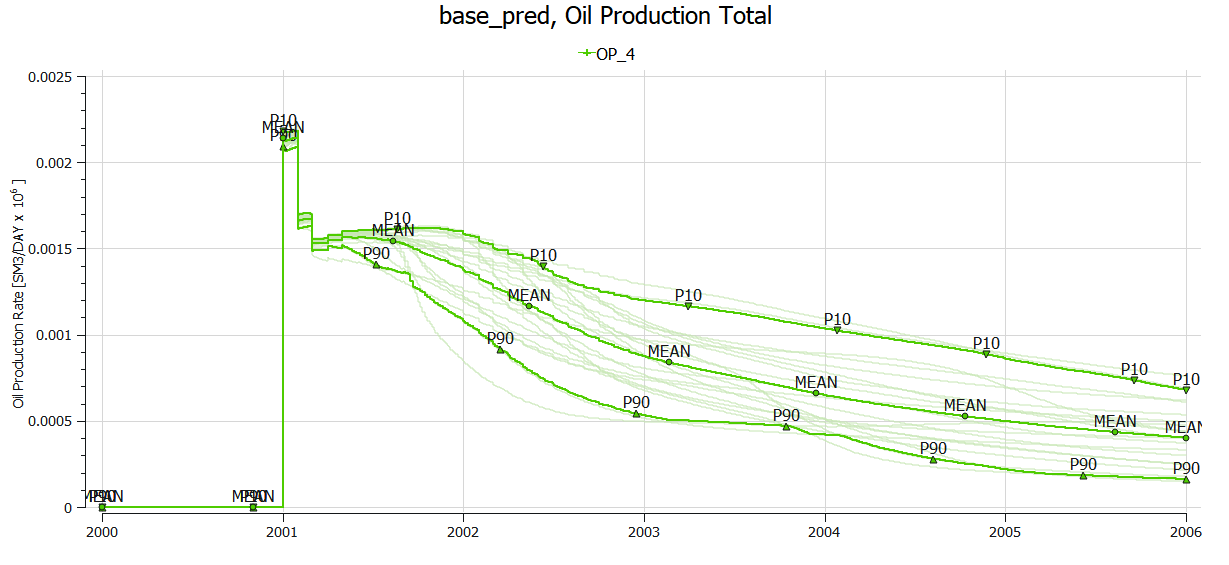
The visual appearance of ensemble curves has been improved. Ensemble curves are displayed using a brighter color than the statistics curves.
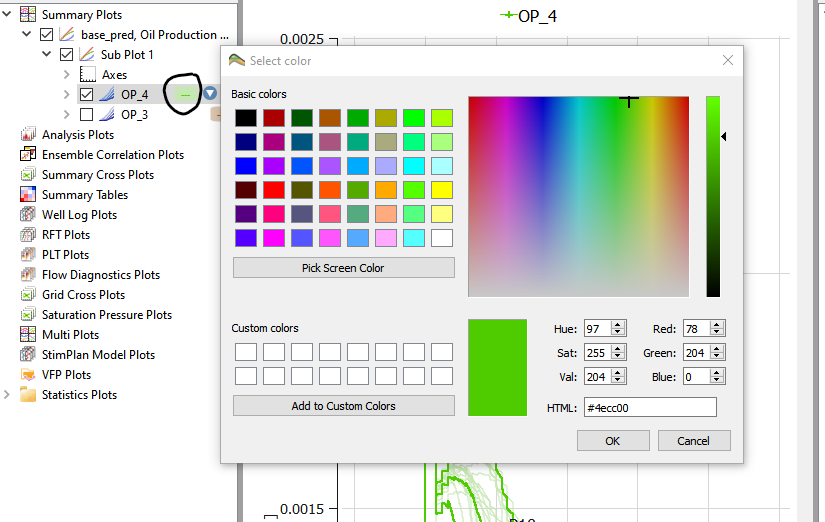
A color selection dialog can be opened by clicking on the color icon in the Project Tree. This feature is also supported for single summary curves.
Other improvements
- Create a new well based on an existing well path
- Improve renaming of summary and ensemble models
- Show Python version in About Dialog
- Full screen mode to maximize screen space for 3D view
- Fault distance calculations performs faster
- In some models, the size of well targets was to small to work with. A scaling factor for Well Targets is now available.
See Release Notes on GitHub for further details and information.