What's New in 2023.01
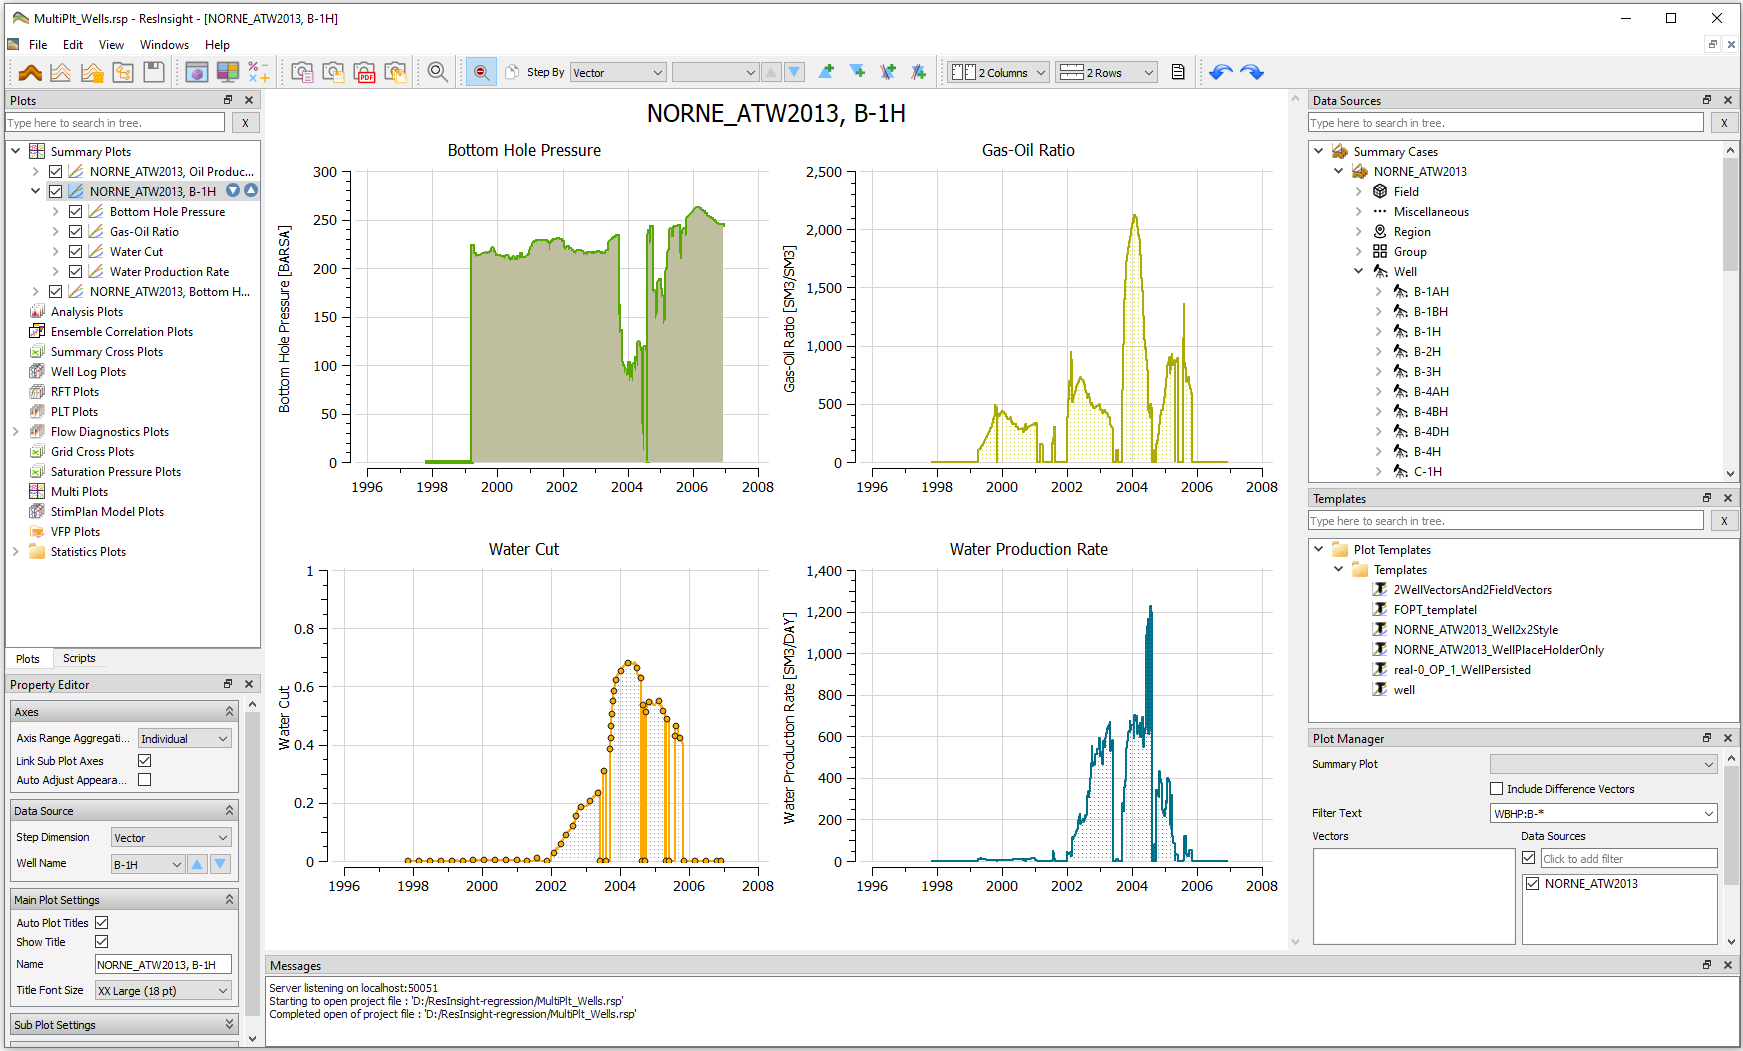
Summary Plotting

Summary Plotting is updated with new features and improved workflows:
- Improved logarithmic legend and default ranges
- Visual appearance of curves is now stable when doing Source Stepping
- Curve name and plot name improvements
Change Data Source by Clicking in 3D
The data source for multiple plots can be updated by clicking on a well path in 3D. This feature can be useful for large fields with many wells and you want to investigate a small subset of wells.
Linked Views Improvements
It is now possible to get the result property values from all linked views when left-clicking on a cell in a view. Text is displayed in Result Info, and values from other properties can also be appended. Property filters can now be linked between views, and will also work between multiple cases.
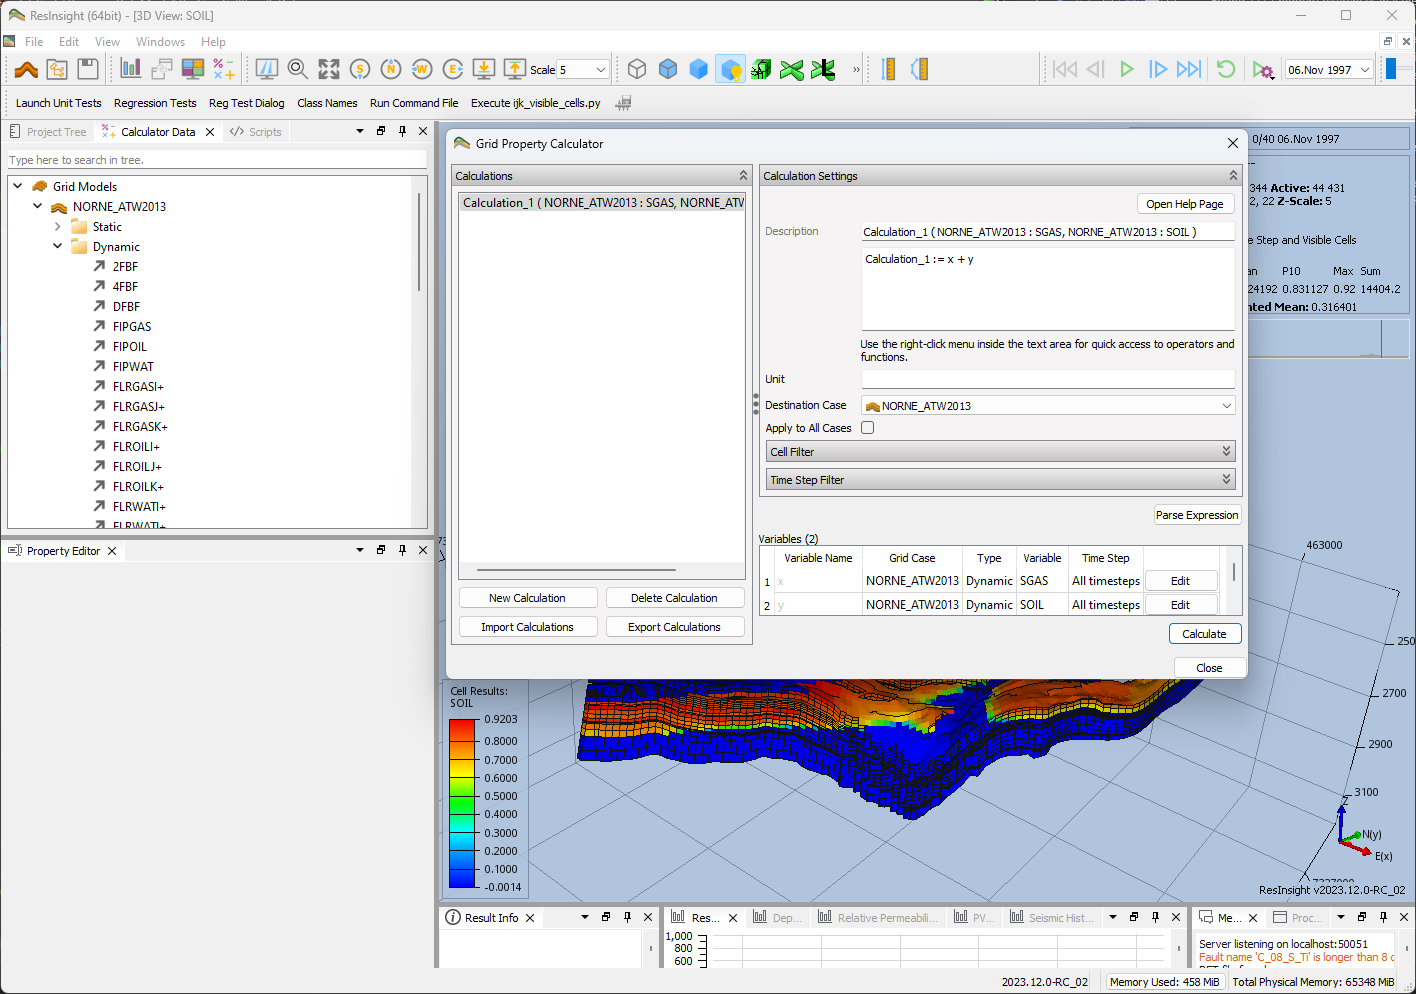
Calculator Improvements

The grid calculator and summary curve calculator is updated with more help and improved usability. The grid property calculations will now always calculate values for active cells and do nothing for other inactive cells.
Breaking changes for user defined well paths
The calculation of the geometry for a user defined well path had some defects. These issues are now fixed, and can affect the generated geometry of a user-defined well path. If the ResInsight project file was stored with a version before 2023.01, loading the project in version 2023.01 and later can potentially generate a slightly different well path geometry from the target at sea level to the first user-defined well target (the location of user-defined well targets are unchanged). The location of perforation intervals and completions are specified by measured depth, and could be shifted to a different location.
Thanks to https://github.com/EdmundStephens for reporting this issue.
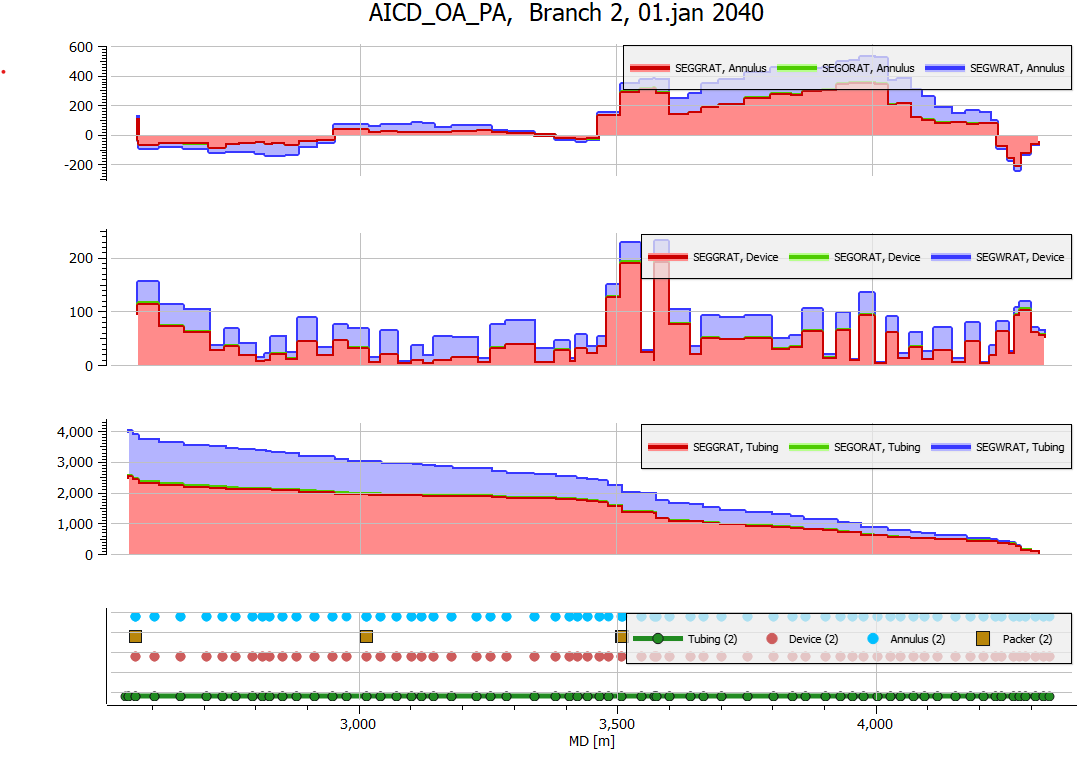
Display of RFT segment curves

RFT Segment Data can be plotted as horizontal Well Log Plots. This feature is now improved with more tracks and improved visual quality.
Import of ROFF files (Preview)
ROFF files with properties can be imported, both in ASCII and binary form. Grid geometry and properties per cell can be imported.
Other improvements
Wrong area for scaled fractures
See Release Notes on GitHub for further details and information.