What's New in 2022.06
Summary Plotting
Summary Plotting is updated with new features and improved workflows:
- data sources for summary data can be used for drag/drop operations and efficient and easy production of plots
- extended summary template features enable more powerful and efficient use of preset appearances and layouts
- optional curve coloring based on the summary vector phase
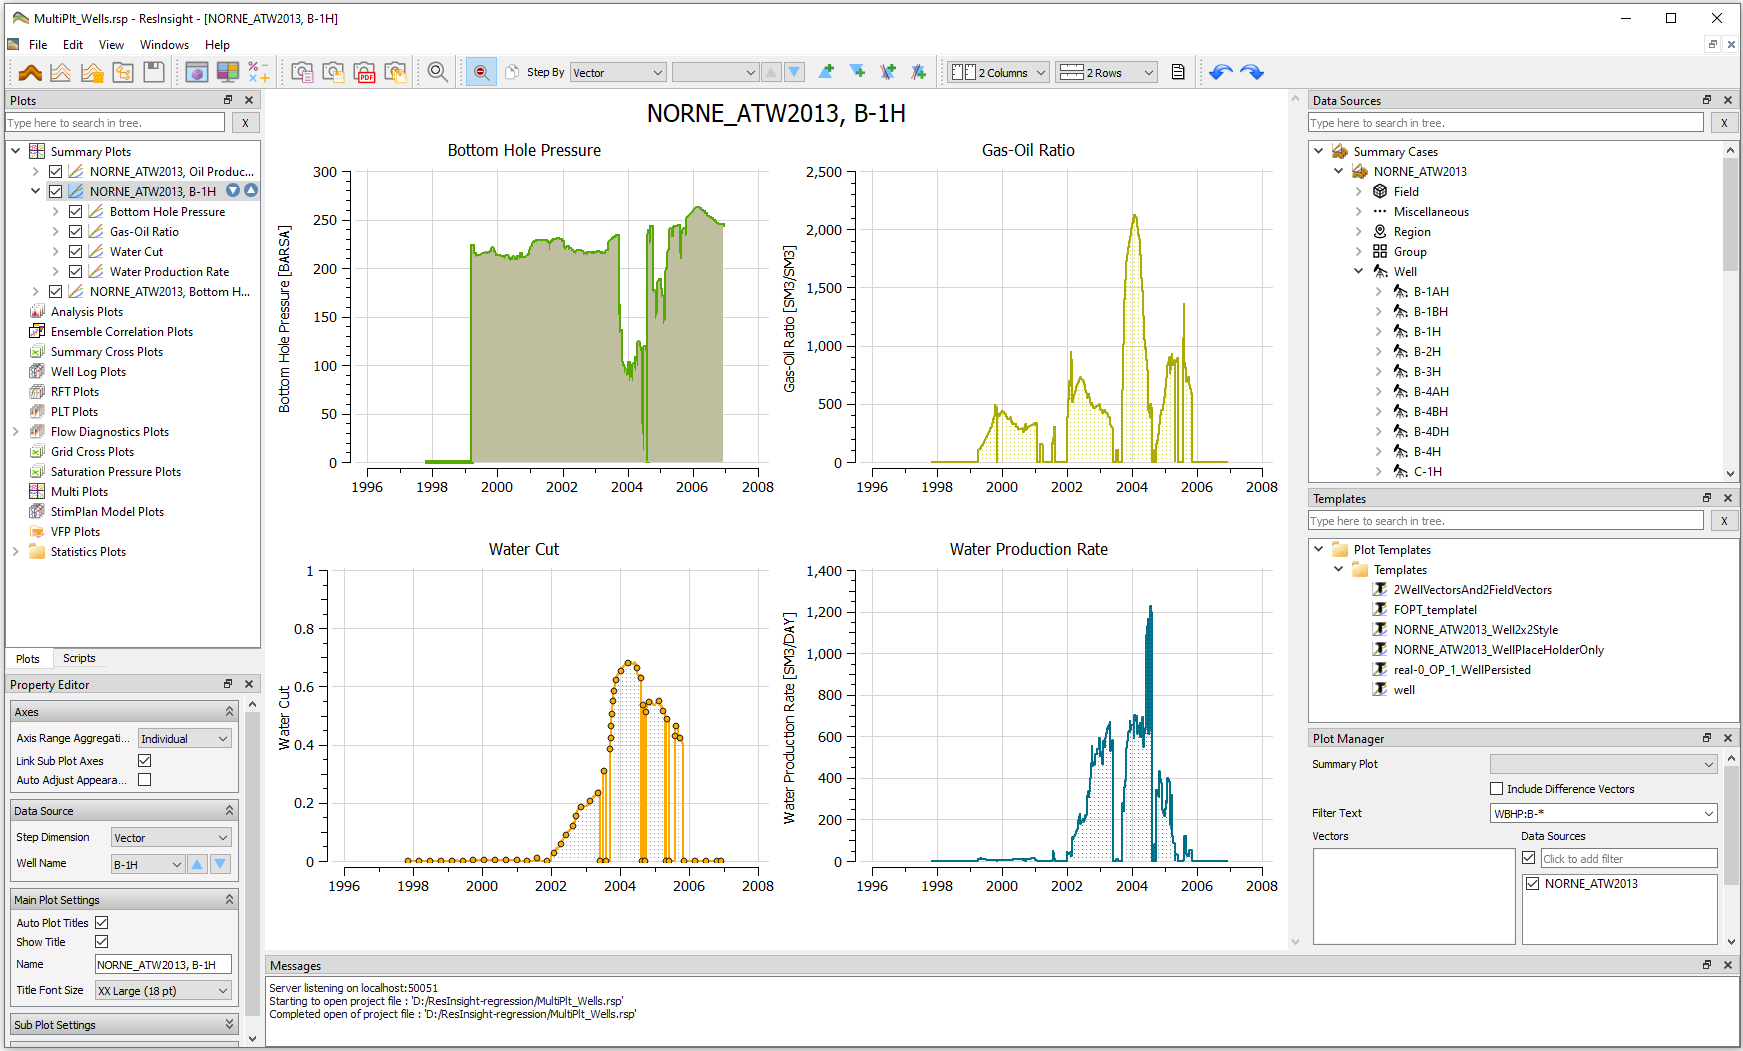
- improved management of multiple subplots
- restructured organization of plot items in Property Editor
- easy and efficient documentation and paging of multiple summary plots to PDF file
Plot Templates
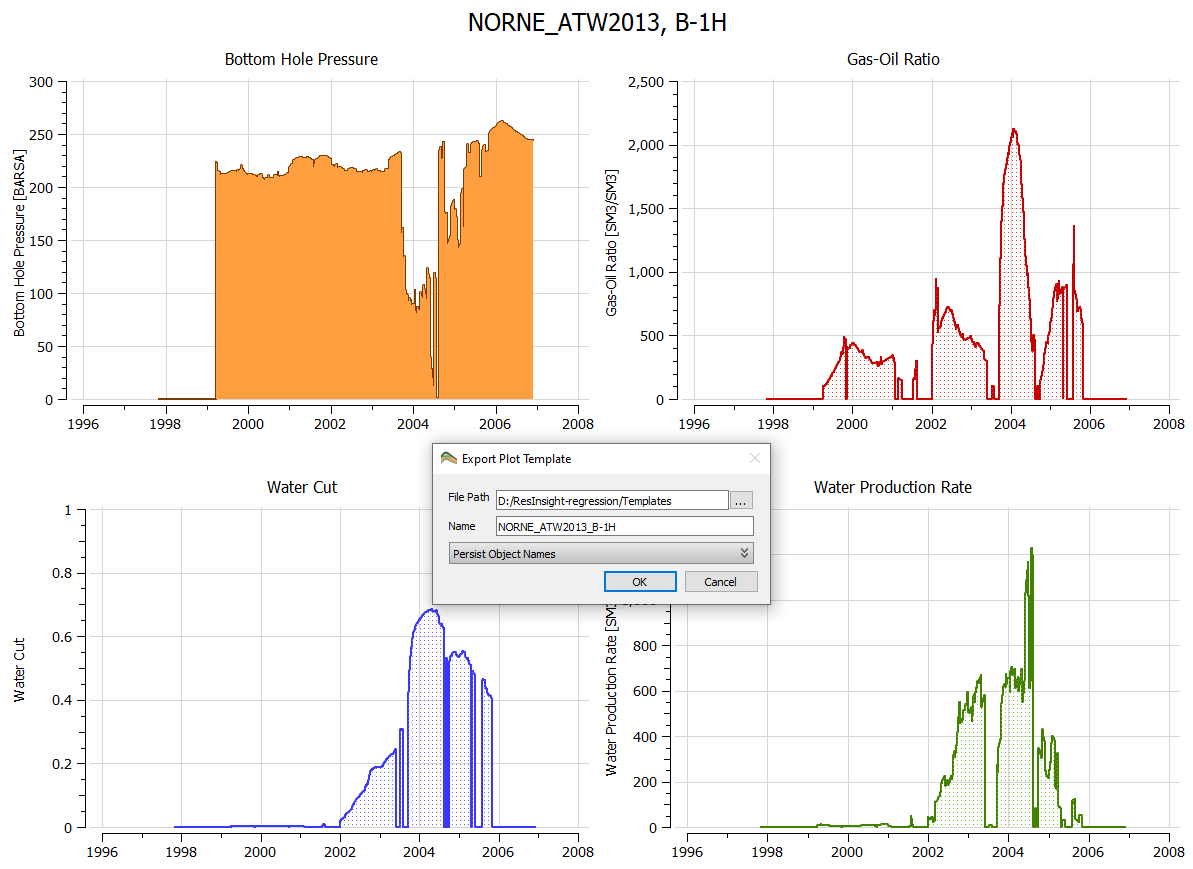
Plot Templates now offer extended features and support for multiplots. For instance, Default templates is a powerful feature to automate the generation of summary plots when importing a summary case.
Improved data source stepping

The new release offers improved features for data source stepping. The new functionality includes, for instance, support for multiple plots and addition of new plots and curves while source stepping.
Multiple Axes
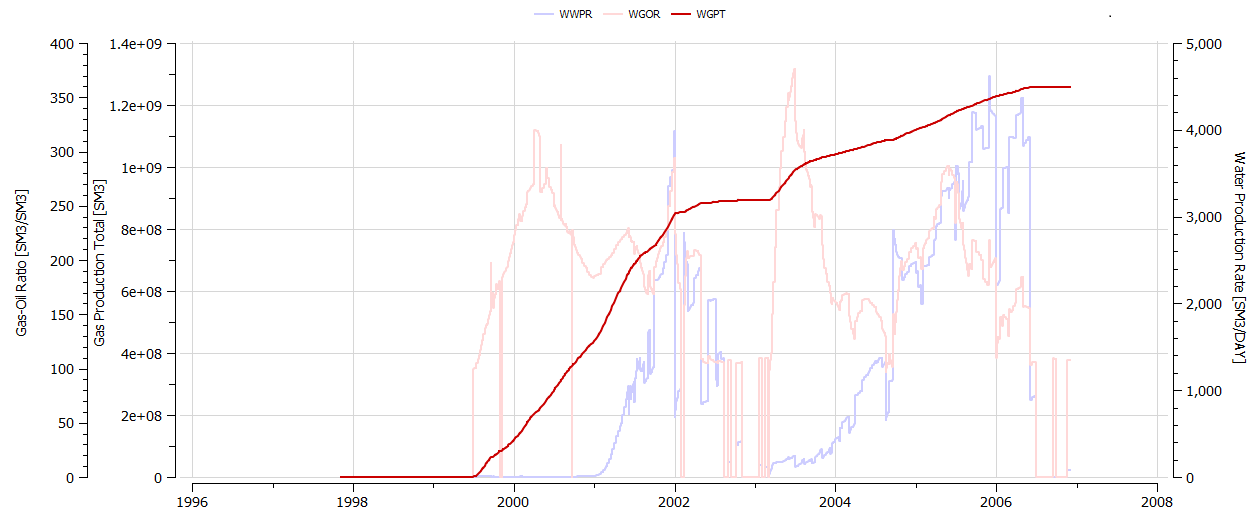
Summary plots can now have Multiple Axes on both left and right side. Clicking on a curve will highlight the curve and connected axis. Clicking on an axis highlights the axis and related curves.
When a new curve is added to a plot, ResInsight automatically creates a new axis if needed.
Plot Manager
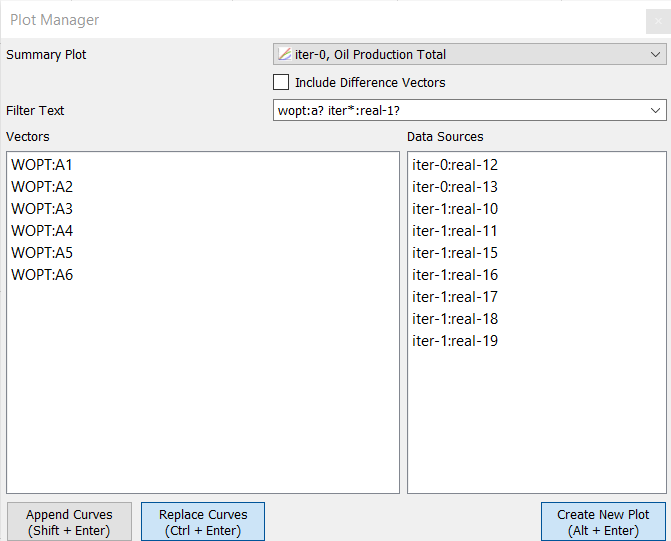
The new Plot Manager offers a powerful approach to create multiple summary plots based on a user specified text filter.
Grid Property Calculator
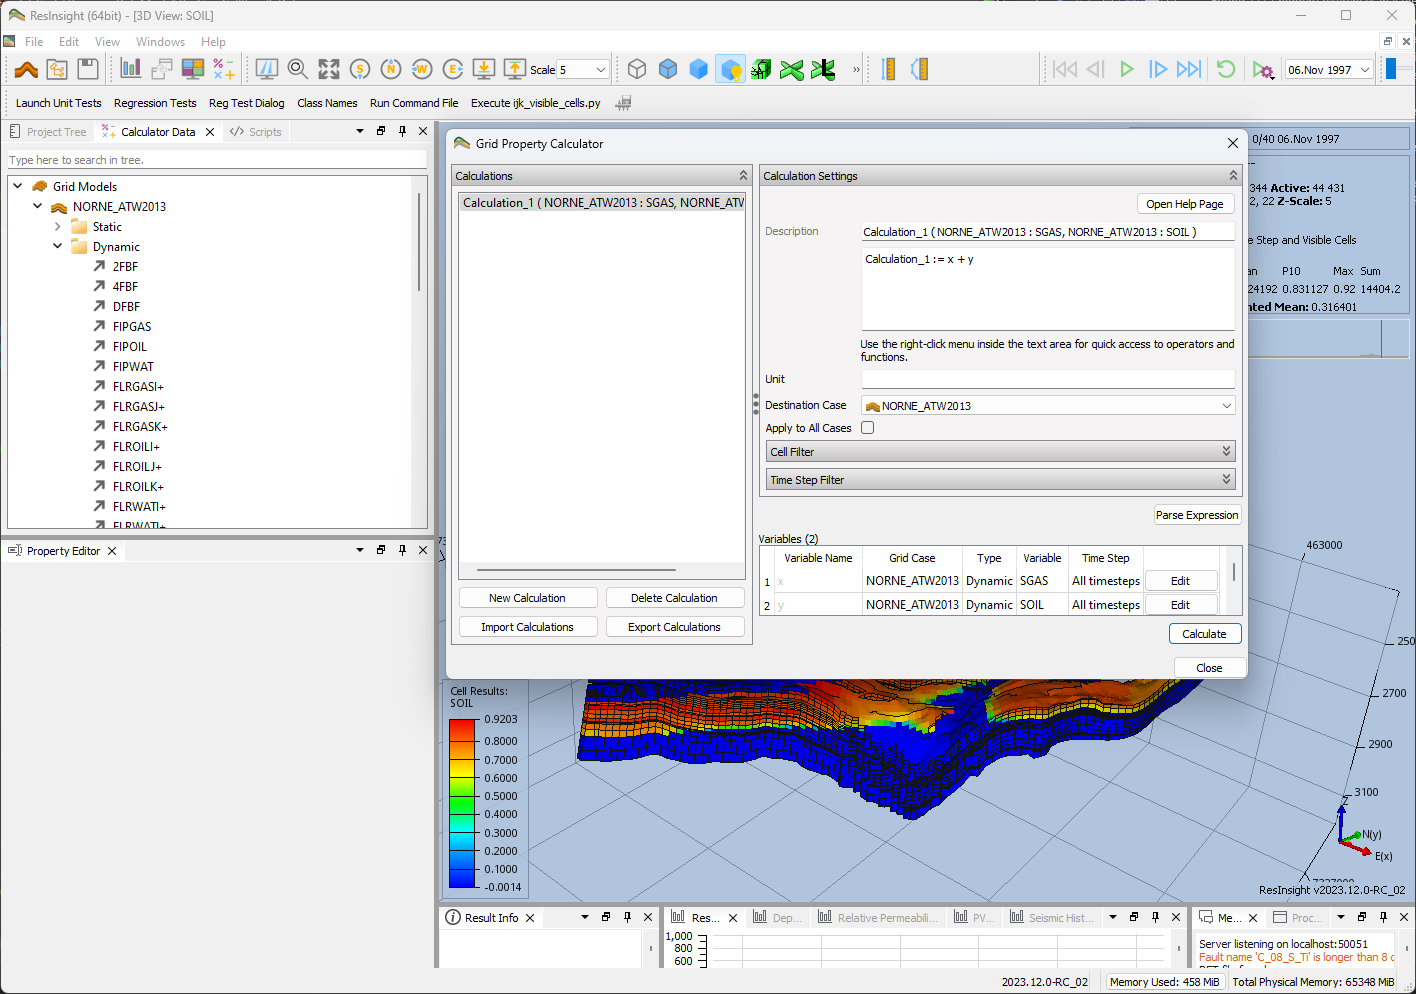
The new Grid Property Calculator can be used to create derived results based on arithmetic expressions. One of the features are easy definition of derived results by drag and drop of grid properties from data sources window.
Filter intersection
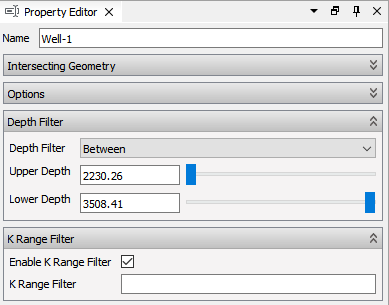
An intersection can be visually filtered by employing a user defined Depth Filter. Depth filtering is simple to perform by selecting an intersection and setting Depth Filter properties.
Restructured windows
The new release offers a restructured windows layout for improved user experience and efficiency. The following are separated into individually dockable windows:
- Data sources for summary data can be used for drag/drop operations and efficient creation of plots
- Scripts are now available as separate windows
- Templates are available in a separate window
Display of RFT segment curves
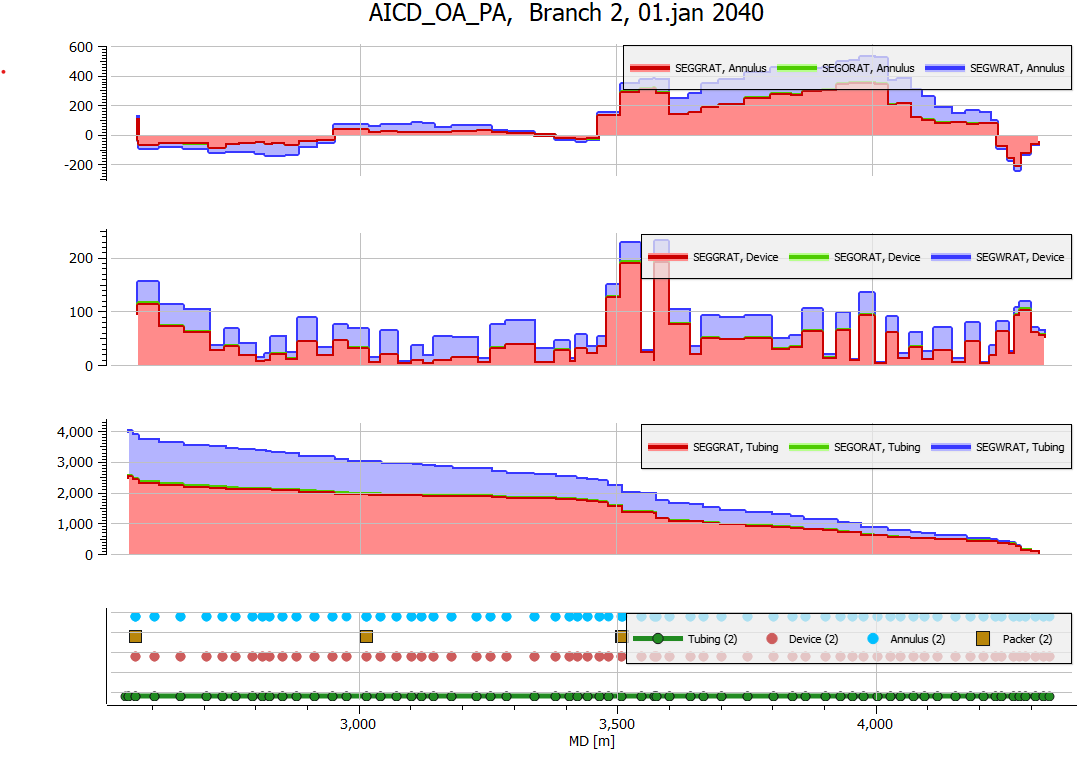
RFT Segment Data can be plotted as horizontal Well Log Plots.
See Release Notes on GitHub for further details and information.