What's New in 2020.10
ResInsight 2020.10 is the latest version of ResInsight, the professional quality, open source 3D visualization, curve plotting and post-processing tool for reservoir models and simulations. Version 2020.10 is a major update bringing a range of significant new and enhanced features.
Surfaces
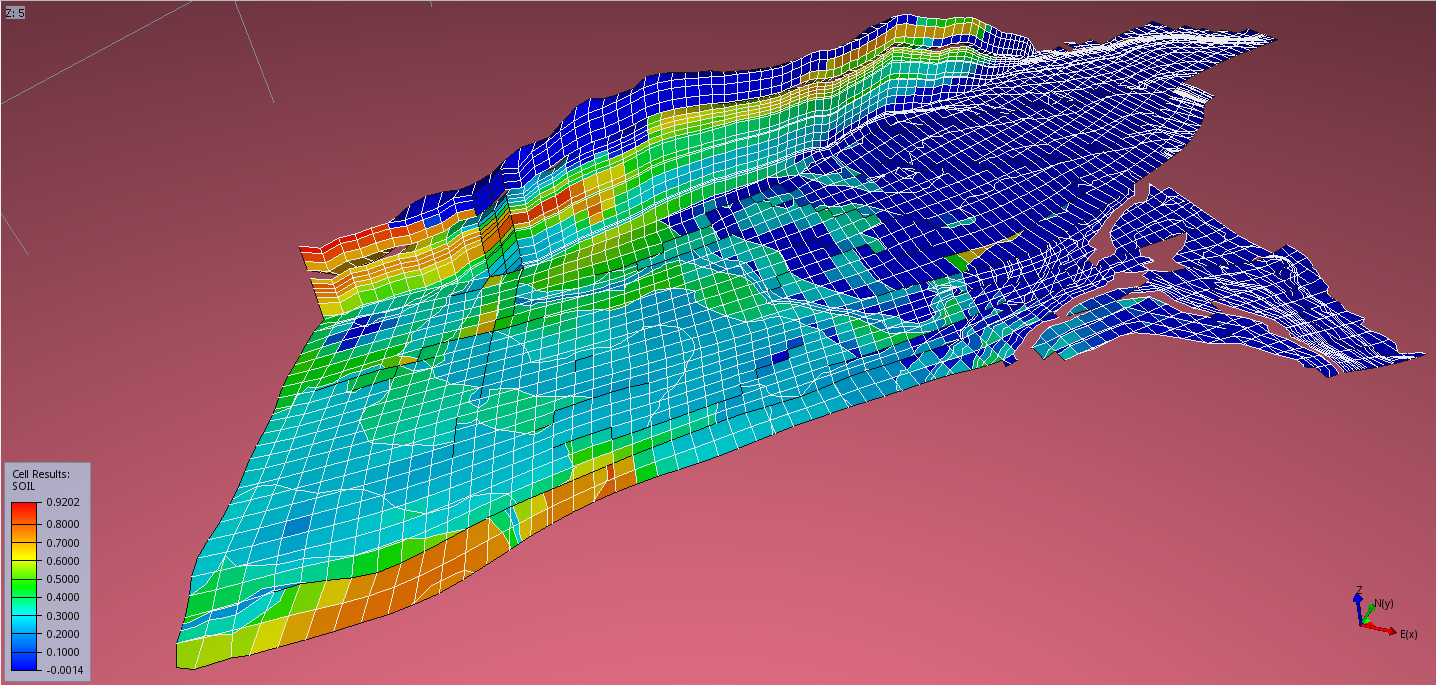
ResInsight supports import of 3D Surfaces , and allows mapping properties and simulation results onto these surfaces. In addition, it is now possible to create a surface from the top of a K-layer in a grid model.
OpenWorks XYZ file format is now supported.
Color Management
Color Legends can be customized and managed by the user. User defined color legends can be used for any result mapping.
Analysis Plots
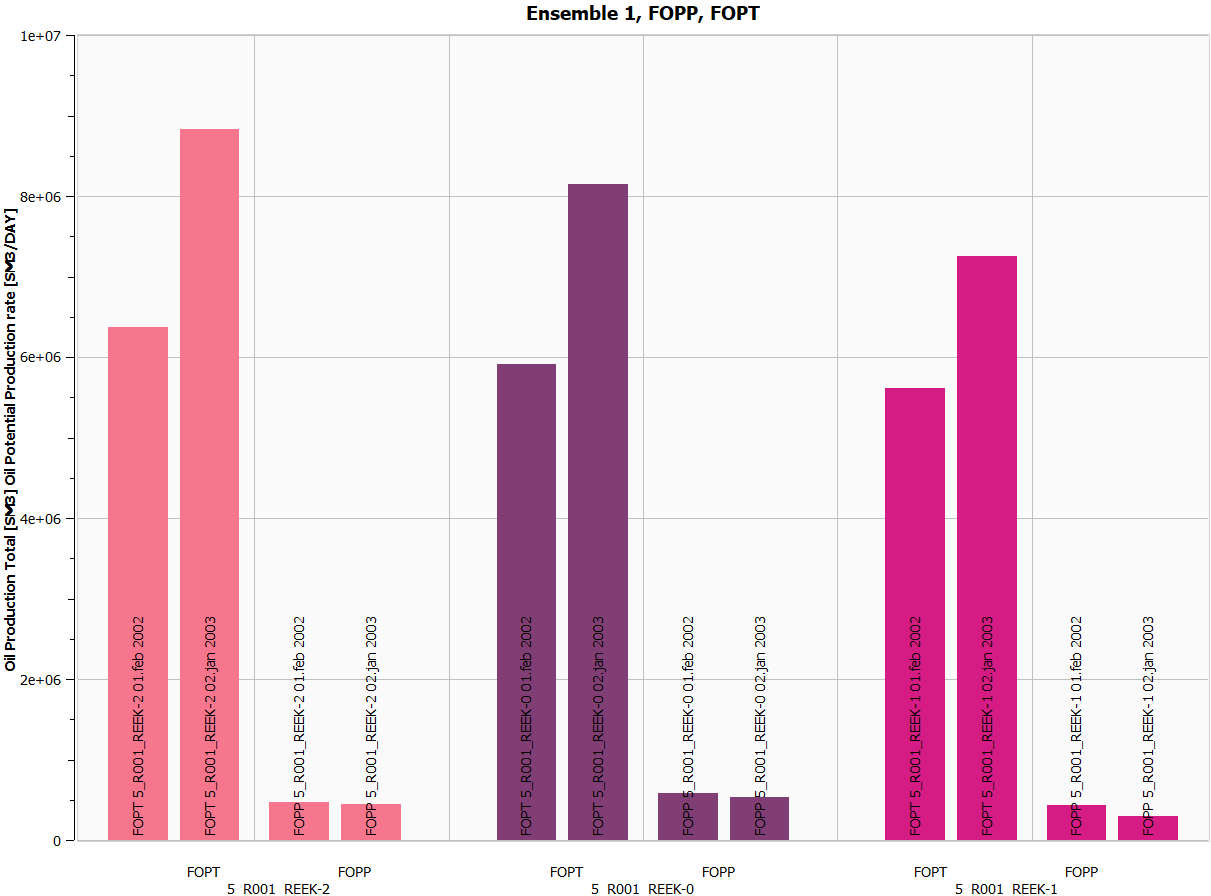
Analysis Plots are bar charts used to compare summary data at specific timesteps across Ensembles and Summary Cases.
Correlation Plots
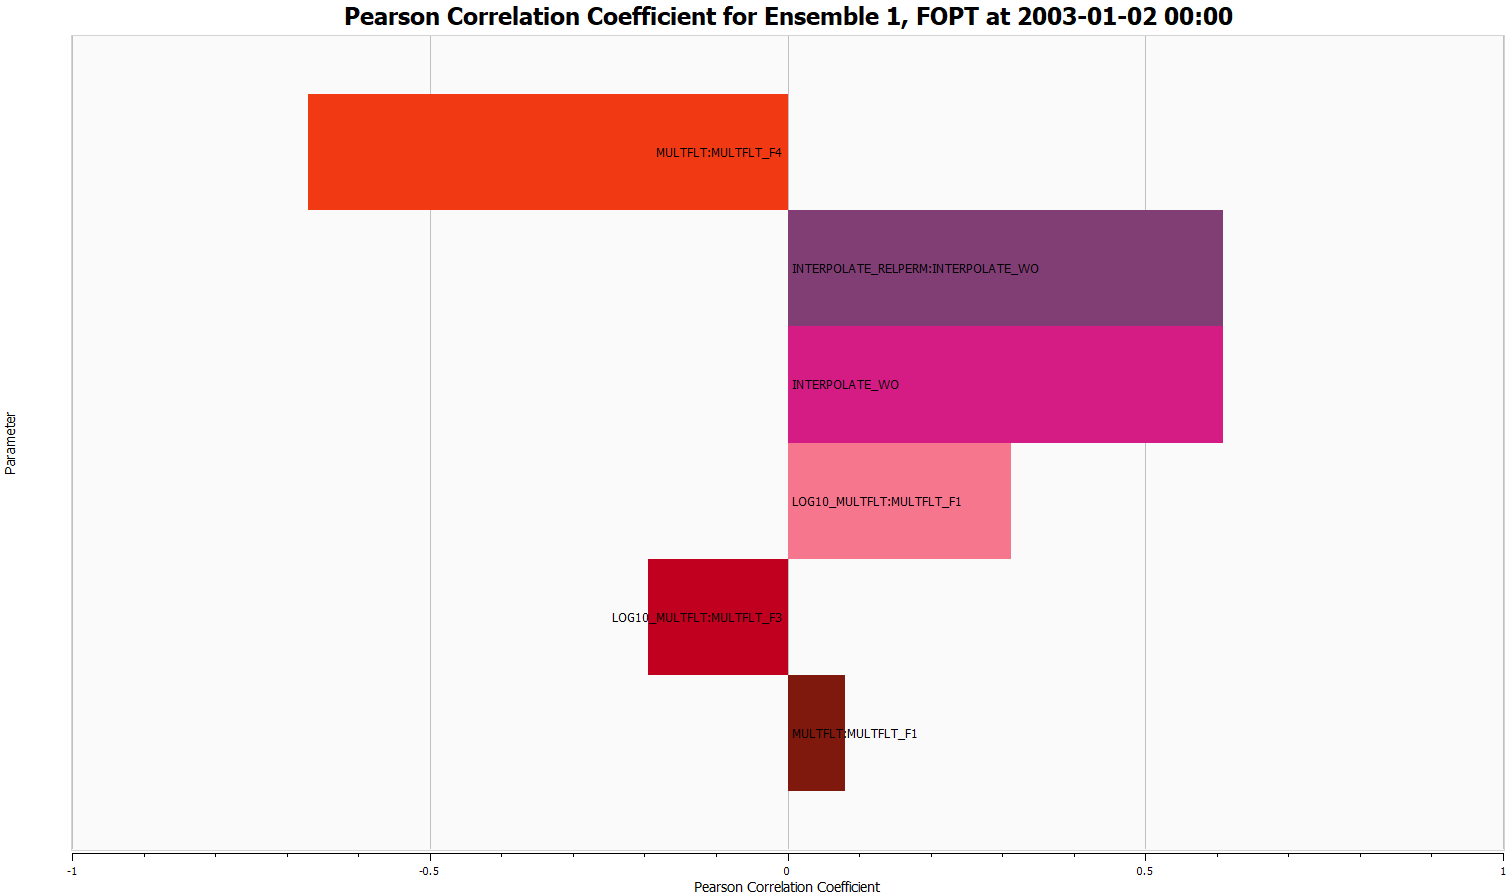
Correlation Plots are plots used to visualize correlations between ensemble parameters and summary result vectors. Several visualizations can be created, including tornado plots, correlation matrices, and cross plots.
Derived Geomechanical Results
More derived geomechanical results are now available. These includes Mud Weight Window, Stress Anisotropy timelapse, Shear Slip Indicator and Pore Compressibility.
For more details on these parameters see Geomechanical Derived Results
Flow Vectors
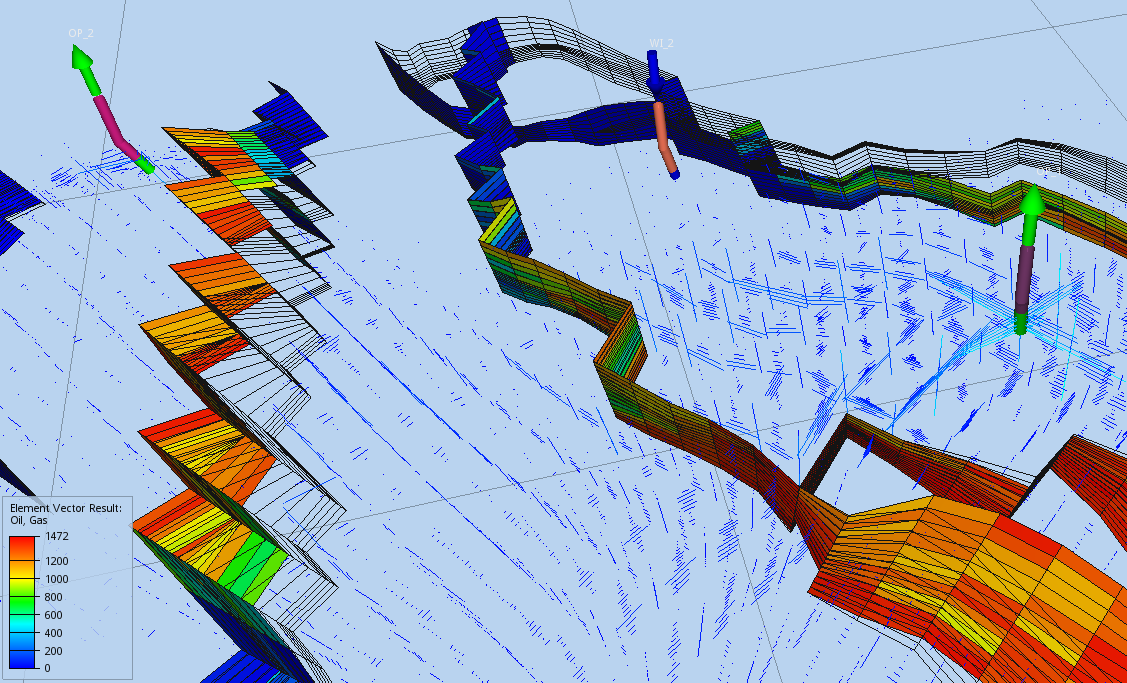
The Flow Vector Result View lets the user investigate fluxes by visualizing flow vectors in the reservoir. It allows for selecting and combining different fluids and directions.
Application Themes
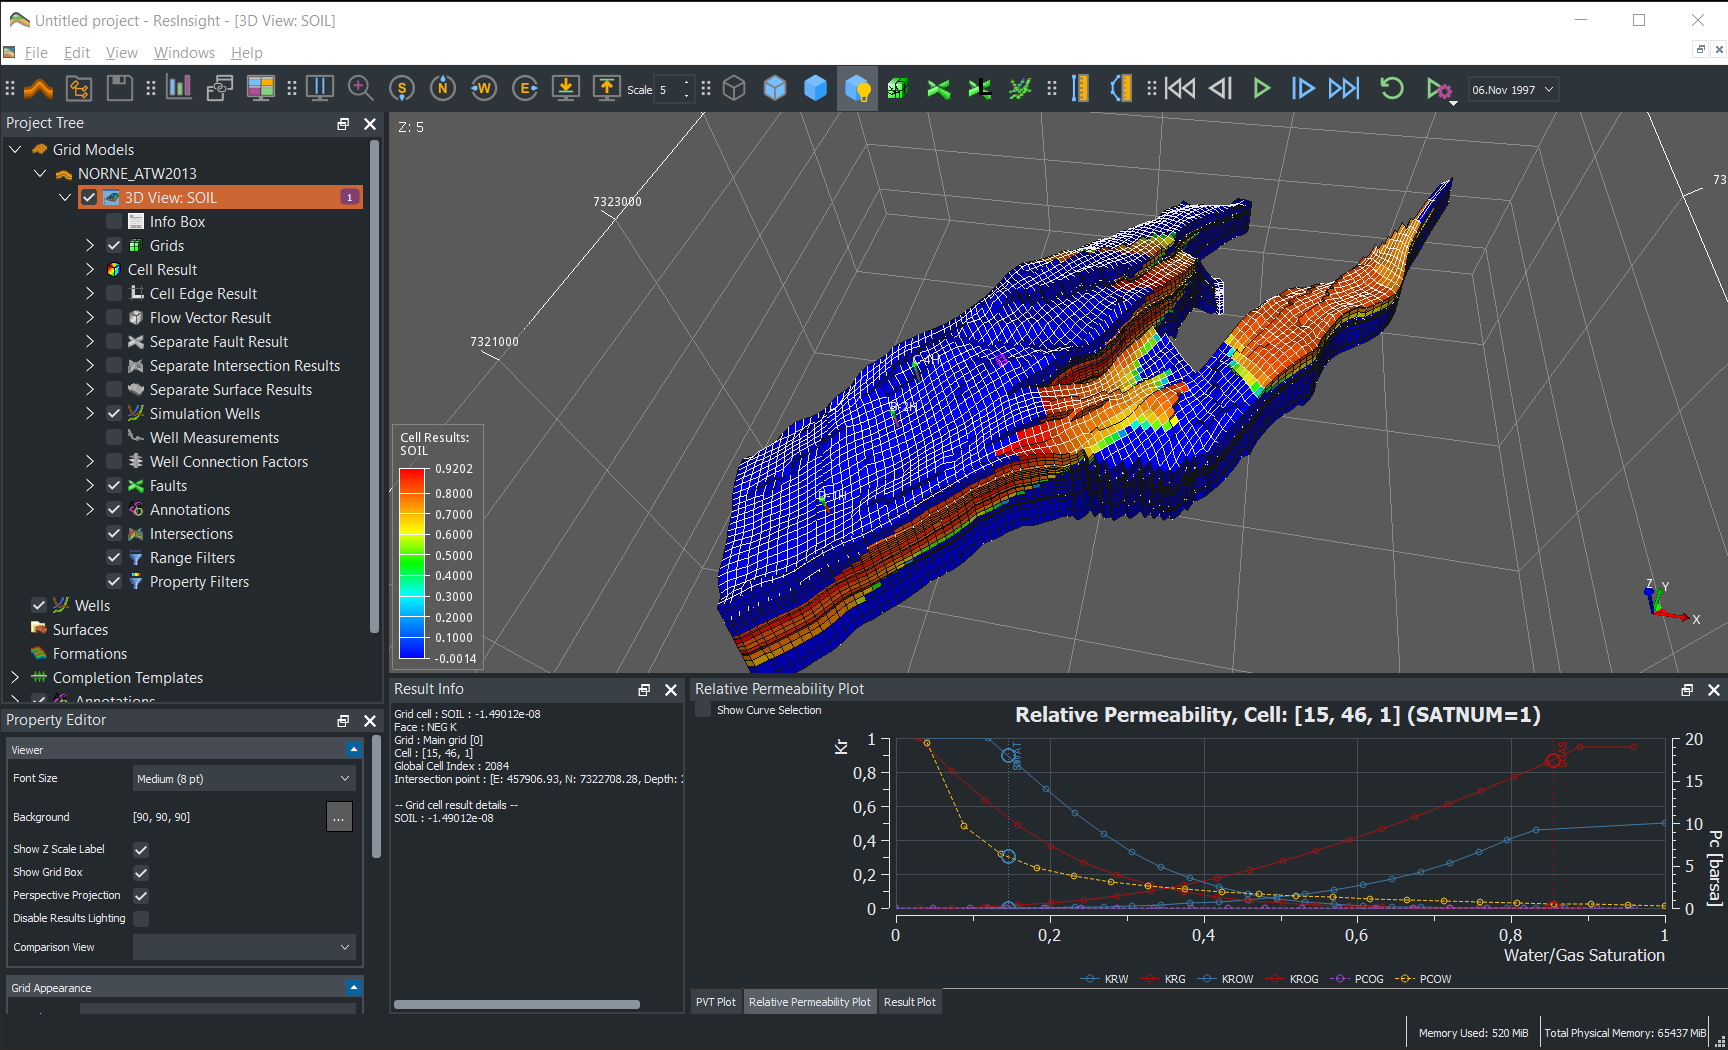
An increasing number of engineers are now used to working with customized visual themes on their desktops. In order to allow the users to work with ResInsight in this settings, we have established support for application themes. Many icons are also updated to improve communication with the user.
The active application theme can be modified from Preferences->GUI Theme
Python Documentation
The Python documentation is updated with new features
Here are the highlights of new features for Python
- Surface management
Release Notes on GitHub
