What's New in 2020.04
ResInsight 2020.04 is the latest version of ResInsight, the professional quality, open source 3D visualization, curve plotting and post-processing tool for reservoir models and simulations. Version 2020.04 is a major update bringing a range of significant new and enhanced features.
Surfaces
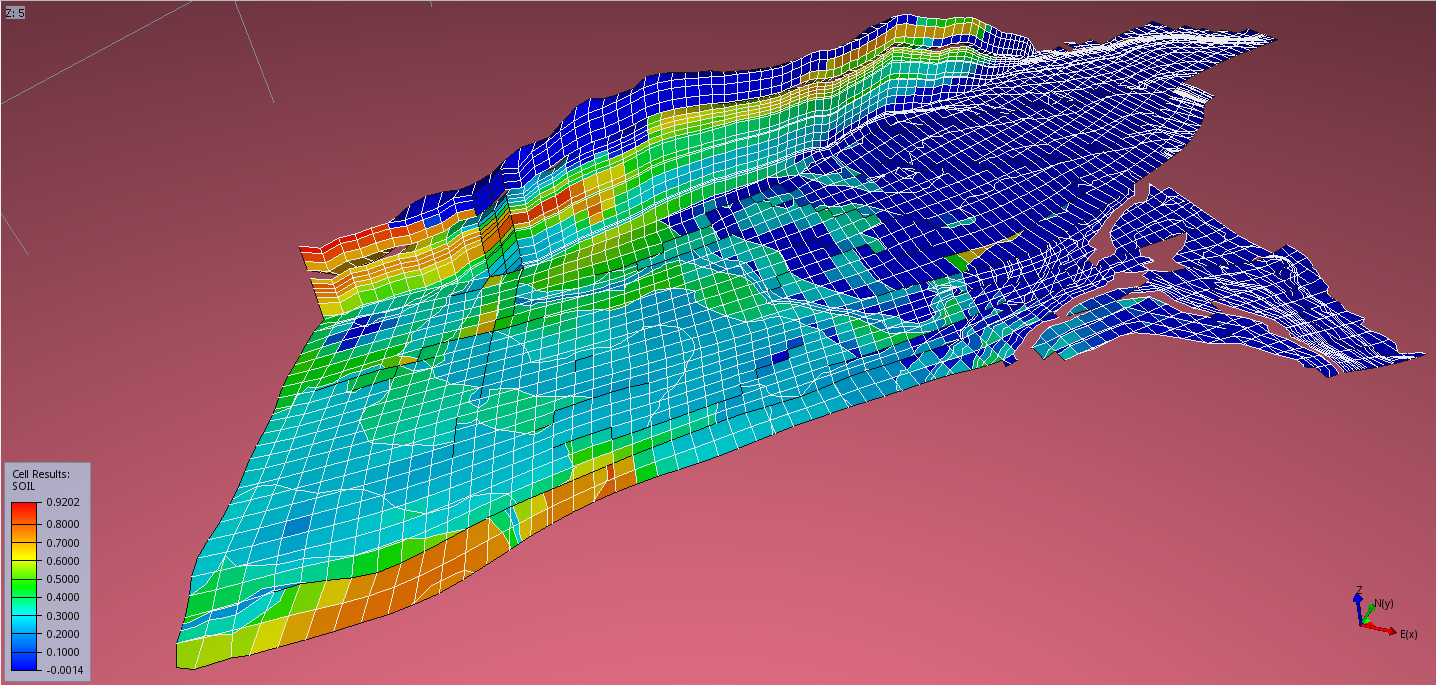
ResInsight supports import of 3D Surfaces , and allows mapping properties and simulation results onto these surfaces.
Allan Diagrams
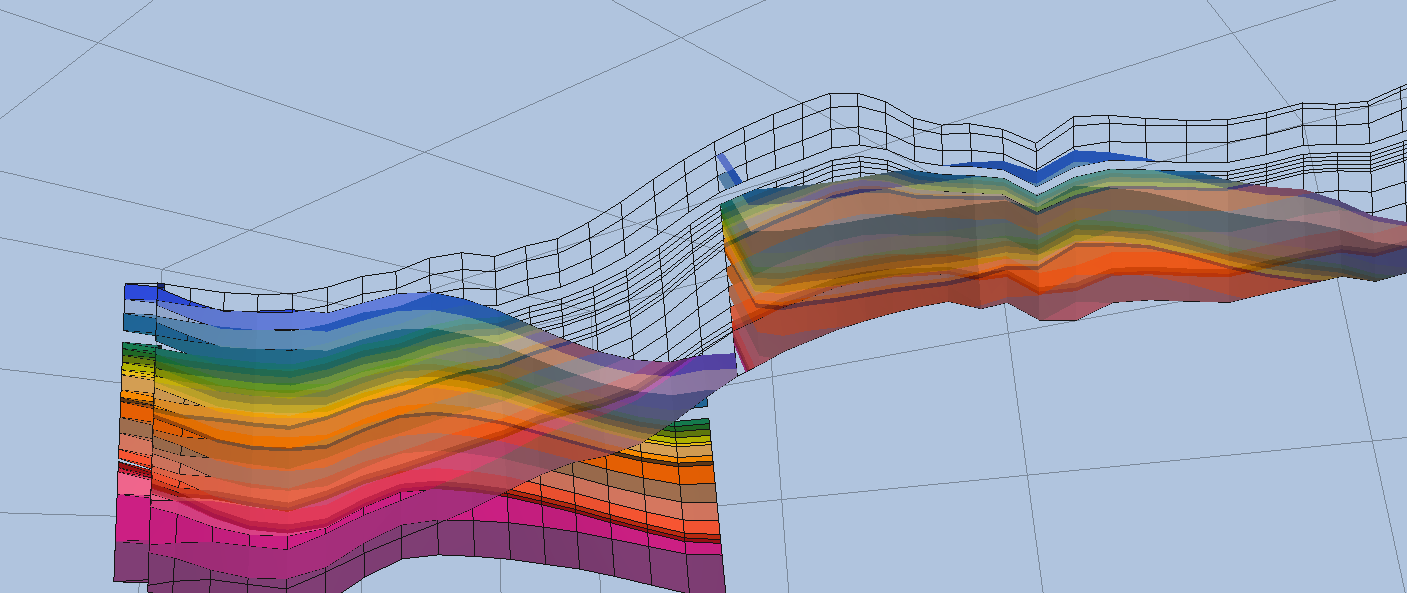
Allan Diagrams displays the overlap of formations and layers across fault faces.
Cumulative Phase Distribution Plots
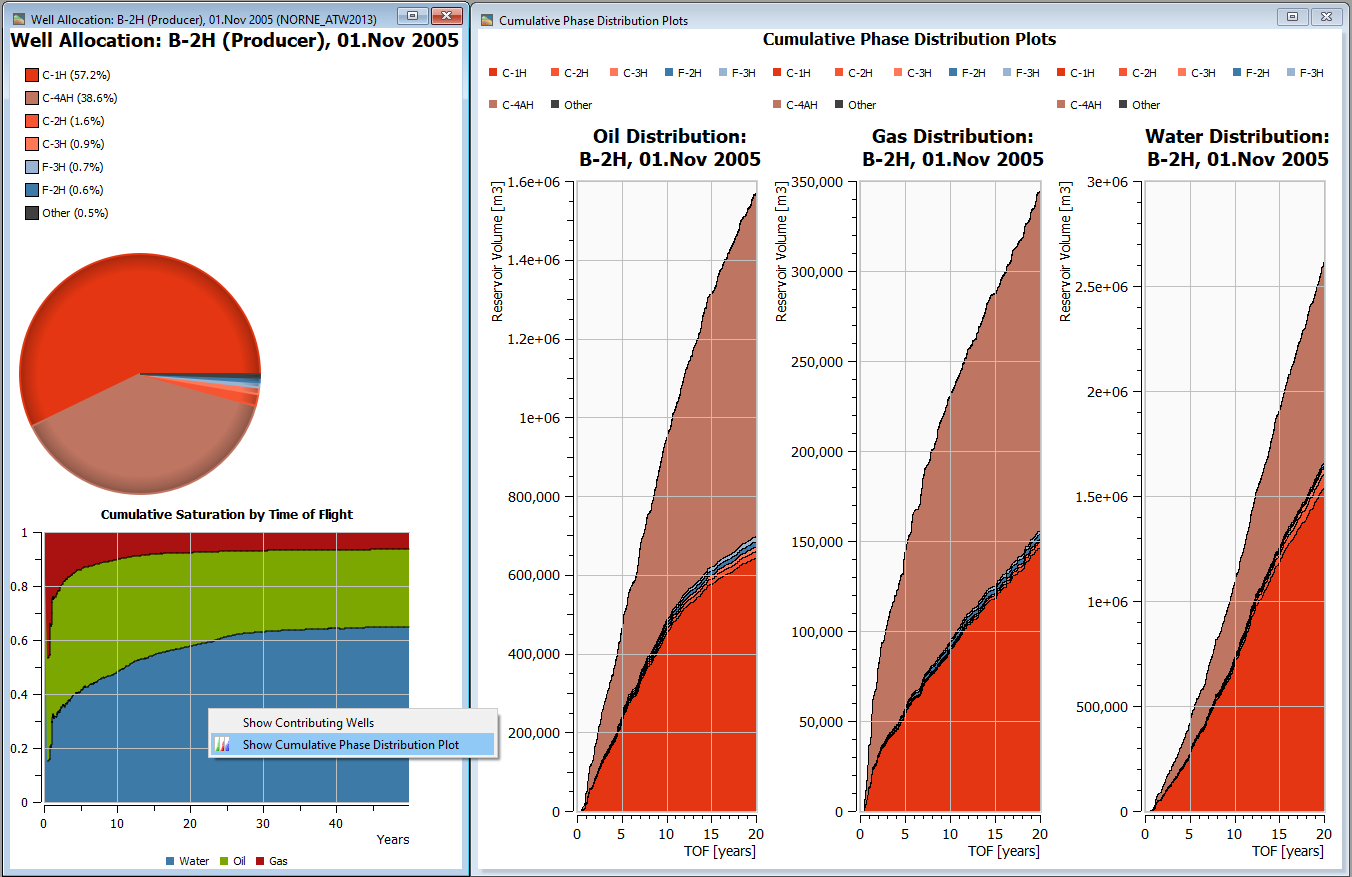
A Cumulative Phase Distribution Plot shows the volumetric oil, gas, and water distribution from contributing wells to a target well.
Delta Summary Case and Ensemble Case
The difference between two summary cases or two ensembles can be established using Delta Ensemble and Delta Summary Case.
Well Disks
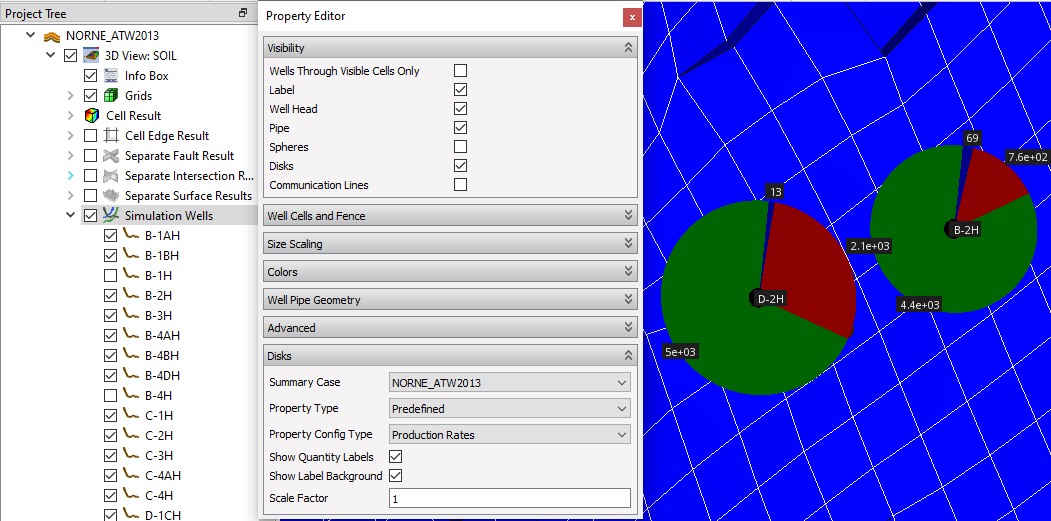
Well Disks may be used to visualize production and injection rates and cumulative production and injection with oil, gas, and water phases shown in green, red, and blue, respectively. Optionally, the quantity of production and injection can be displayed.
Python Documentation
The Python documentation is now available on a separate site.
Here are the highlights of new features for Python
- Summary data
- Simulation well data - status and active connection for given time step
- Grid and cell geometry
- NNC data
Multi Plot
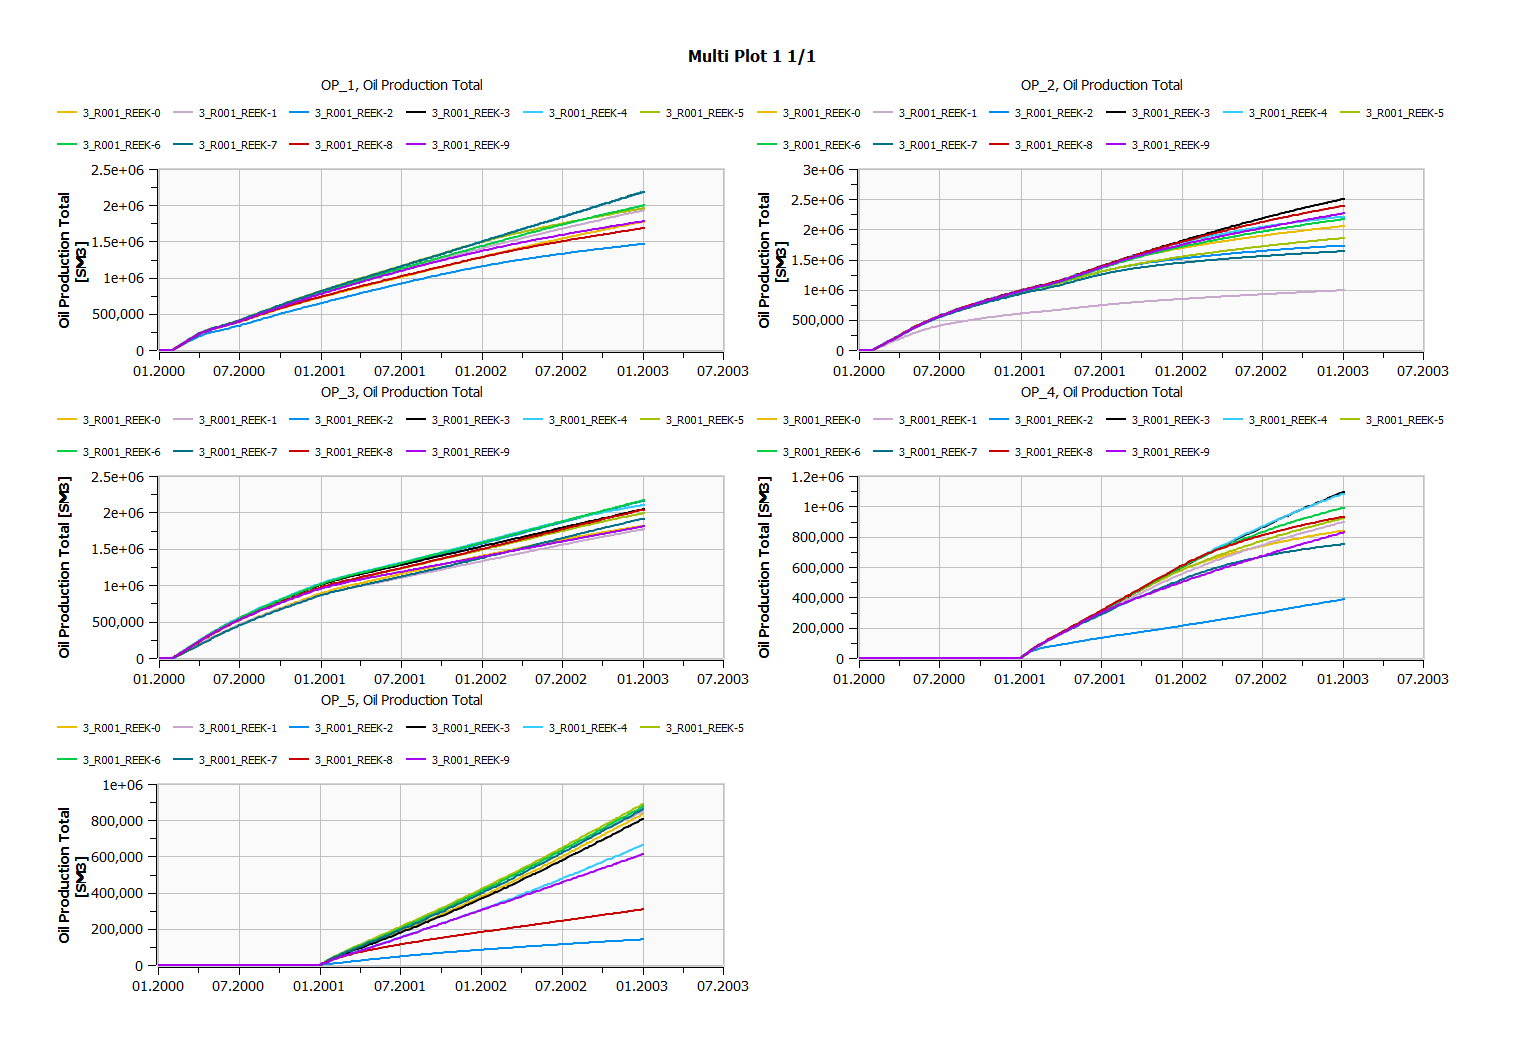
A Multi Plot allows the user to combine multiple plots in a grid layout. Plots from different types can be combined. This plot type is tailored for export to PDF.
Well Measurements
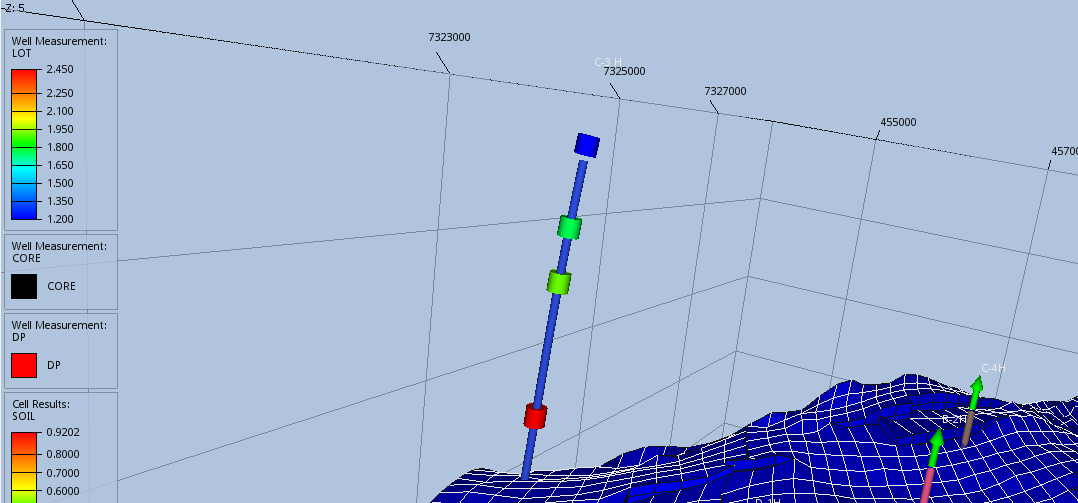
ResInsight can import Well Measurements and show the location of measurements by using symbols in the 3D view.
Additional News
Well Bore Stability Plot
More parameters are now available for Well Bore Stability Plot, and it is now possible to create and modify these plots from Python.
Combine Multi Case Results in one View
In a view displaying result values from one case, ResInsight also supports display of results from other cases. This feature is available for Faults , Intersections , and Surfaces
References to External Files
All external file references are now located at the top of the Project File enabling the user to efficiently change referenced data.
Release Notes on GitHub