What's New in 2019.04
ResInsight 2019.04 is the latest version of ResInsight, the professional quality, open source 3D visualization, curve plotting and post-processing tool for Eclipse reservoir models. Version 2019.04 contains a larger number of new and exciting features, some of which are listed below.
Grid Cross Plots
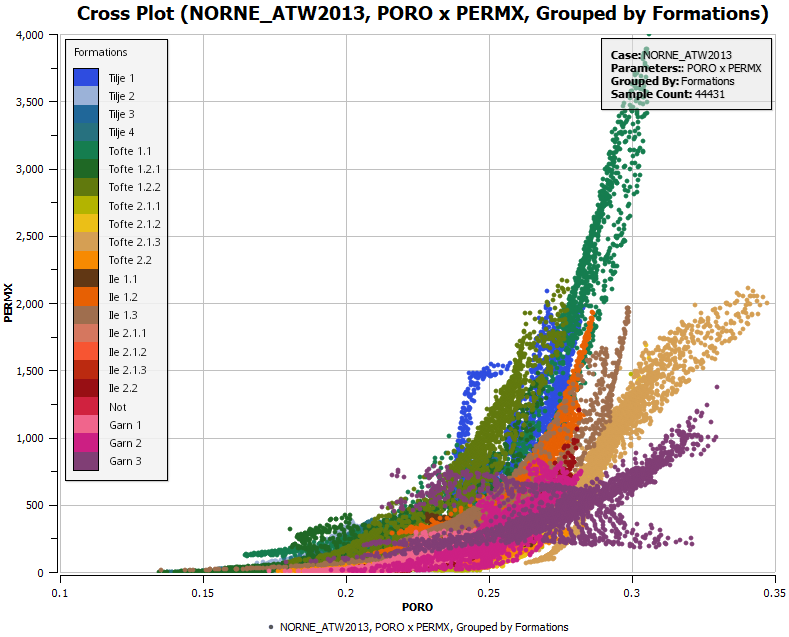
ResInsight supports the creation of cross plots of two results against each other, with each cell in the grid representing one data point in the plot. The data points can be grouped by a third result, by time step or by Formations, giving a separate color and label for each group.
See Grid Cross Plots
Saturation Pressure Plots
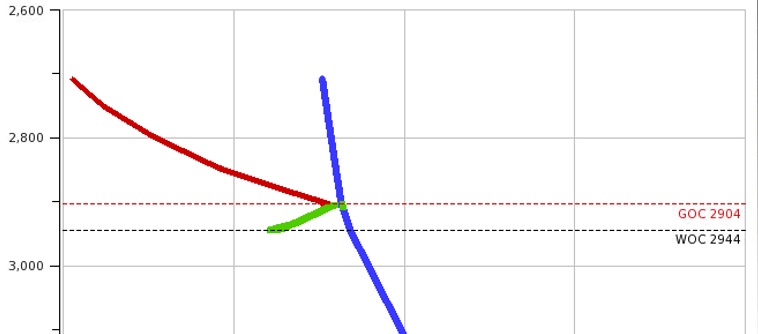
ResInsight can create plots displaying bubble and dew point pressures, together with initial pressure in model, versus depth. Fluid contacts (GOC and/or OWC) are displayed as annotation lines in the generated plots.
Sector Model Export
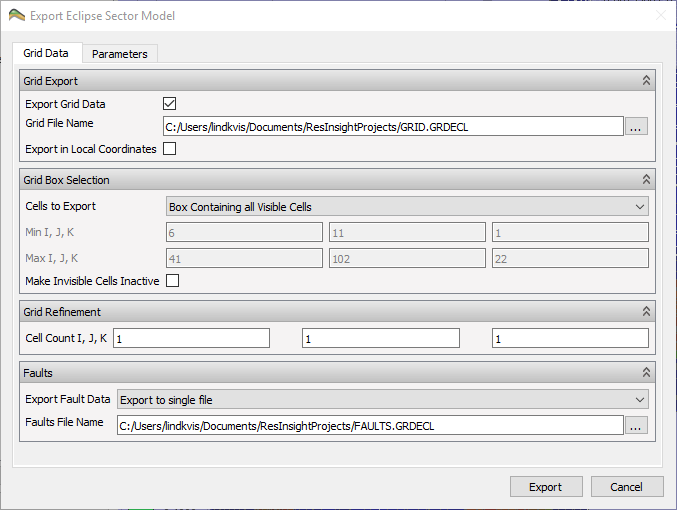
Sub-sections of the Eclipse Grid with Parameters and Faults can be exported to Eclipse ASCII files in order to create new Simulations on the sub-section. These sub-sections can also be refined to a higher resolution.
Well model for ICD, AICD and ICV
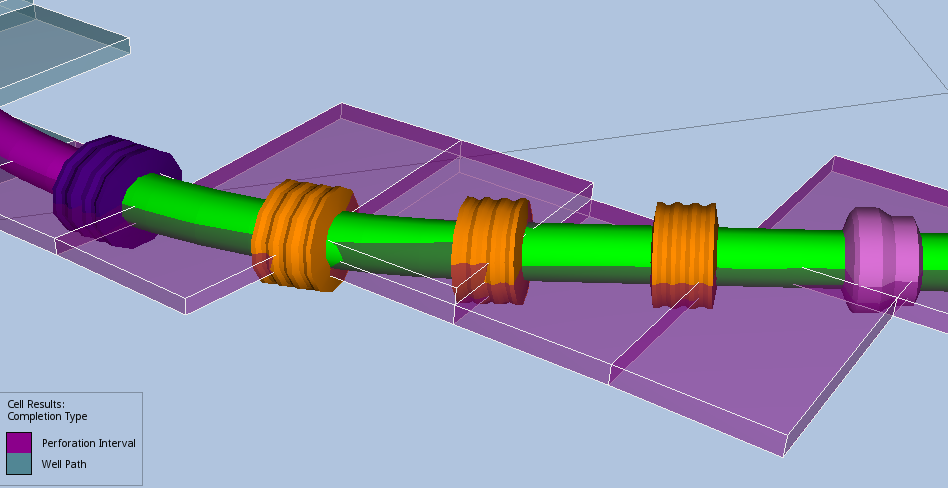
ResInsight supports interactive modeling of ICD, AICD and ICV. It is possible to export completions to a text file containing the Eclipse input data keywords needed to represent the completions as a Multi Segment Well - MSW.
See Completions and Completion Export
Grid Model Annotations
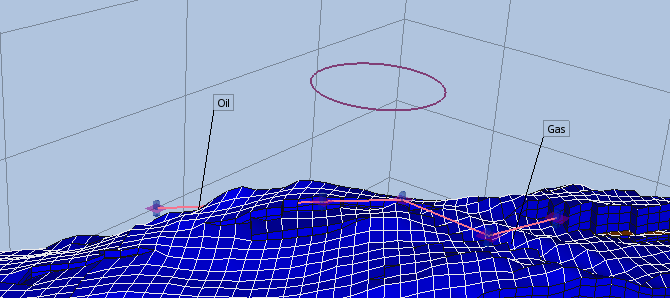
Annotation objects like text, lines and plolylines can easily be added to a view.
See Annotations
Grid Measurements
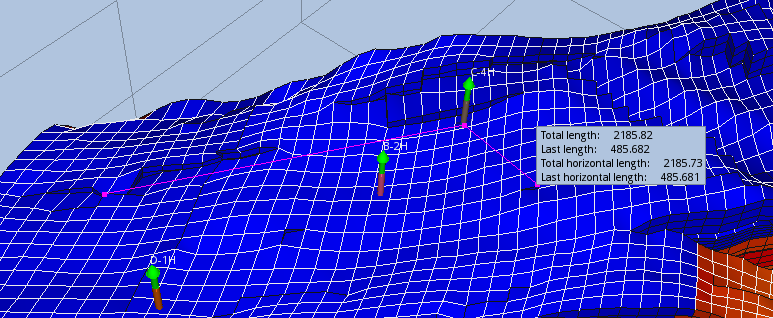
ResInsight now supports measuring distances and polyline lengths across a Grid.
See Measurements
Keyboard Shortcuts
Several new keyboard shortcuts have been added to ResInsight for convenience. The shortcut can be seen by hovering over tool bar icons to show the tooltip for the given action, or seen in the right-click menu for project tree items.
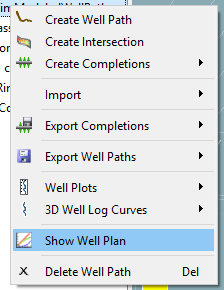

For instance will the Delete key now delete any deletable item in the project tree and Ctrl-Alt-S/N/W/E/D/U will change the 3d Camera view to South, North, West East, Down and Up respectively.