Grid Ensemble
A Grid Ensemble groups several grid realizations under Grid Models in the Project Tree. Grid ensembles are imported with the Grid and Summary Ensemble dialog.
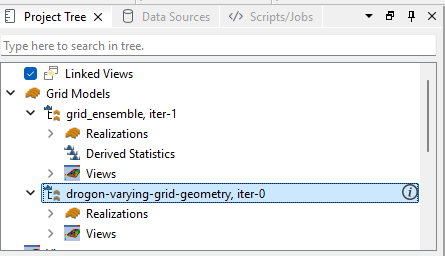
Each grid ensemble contains a Realizations folder with the individual grid cases and a Views folder with its 3D views. Depending on the grid geometry, a Derived Statistics folder may also be present.
Viewing Realizations
A single view can display any of the individual realizations in the ensemble. Use the realization dropdown list in the view to step between realizations without creating a separate view for each one.
Grid Geometry
The operations available on a grid ensemble depend on how the grid geometry varies between its realizations.
- Identical IJK – all realizations share the same I, J and K dimensions. Per-cell statistics can be computed across the realizations, so a Derived Statistics folder is available. In the example above, grid_ensemble, iter-1 is of this type.
- Identical IJ, varying K – all realizations share the same I and J dimensions, but the number of K layers varies. This is indicated by the info icon next to the ensemble in the Project Tree. Because the K dimension differs between realizations, per-cell statistics cannot be computed, and no Derived Statistics folder is present. In the example above, drogon-varying-grid-geometry, iter-0 is of this type.
Derived Statistics
For an ensemble with identical IJK geometry, the Derived Statistics folder computes per-cell statistical properties (such as mean, P10, P90, and min/max) across the realizations. The setup and computation work in the same manner as for a Grid Case Group.
Ensemble Contour Map
Both grid geometry types support contour maps. Right-click the grid ensemble and select New Ensemble Contour Map to aggregate the 3D reservoir simulation data onto a 2D plane. See Ensemble Contour Maps for details.